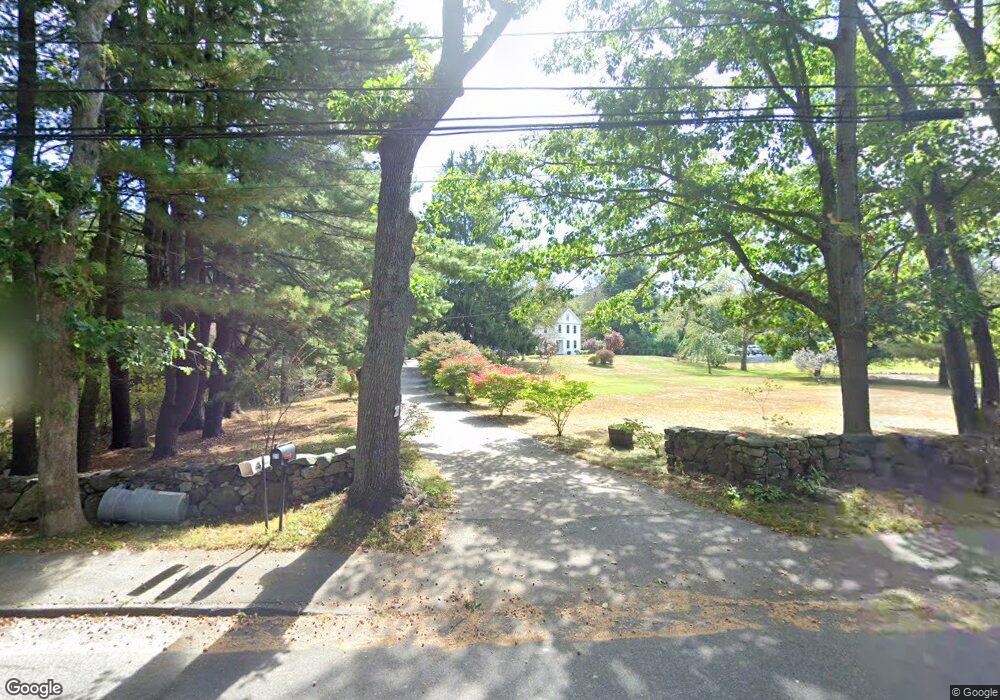
21 Appleton St North Andover, MA 01845
Estimated Value: $792,000 - $911,075
3
Beds
3
Baths
2,059
Sq Ft
$425/Sq Ft
Est. Value
About This Home
This home is located at 21 Appleton St, North Andover, MA 01845 and is currently estimated at $875,769, approximately $425 per square foot. 21 Appleton St is a home located in Essex County with nearby schools including Franklin Elementary School, North Andover Middle School, and North Andover High School.
Ownership History
Date
Name
Owned For
Owner Type
Purchase Details
Closed on
Jul 22, 2004
Sold by
Mcclellan Eleanor B and Dickson Eleanor M
Bought by
Dickson Eleanor M Est
Current Estimated Value
Purchase Details
Closed on
Jun 18, 2004
Sold by
Mcclellan Eleanor B and Dickson Eleanor M
Bought by
Mcclellan Eleanor B and Dickson Eleanor M
Purchase Details
Closed on
Apr 1, 2004
Sold by
Mcclellan Eleanor B and Mcclellan-Dick Eleanor
Bought by
Dickson Eleanor Mcclell
Create a Home Valuation Report for This Property
The Home Valuation Report is an in-depth analysis detailing your home's value as well as a comparison with similar homes in the area
Home Values in the Area
Average Home Value in this Area
Purchase History
| Date | Buyer | Sale Price | Title Company |
|---|---|---|---|
| Dickson Eleanor M Est | -- | -- | |
| Mcclellan Eleanor B | -- | -- | |
| Mcclellan Eleanor B | -- | -- | |
| Dickson Eleanor Mcclell | -- | -- |
Source: Public Records
Tax History
| Year | Tax Paid | Tax Assessment Tax Assessment Total Assessment is a certain percentage of the fair market value that is determined by local assessors to be the total taxable value of land and additions on the property. | Land | Improvement |
|---|---|---|---|---|
| 2025 | $9,688 | $860,400 | $378,500 | $481,900 |
| 2024 | $9,163 | $826,200 | $356,700 | $469,500 |
| 2023 | $9,681 | $790,900 | $327,000 | $463,900 |
| 2022 | $9,324 | $689,100 | $294,300 | $394,800 |
| 2021 | $8,987 | $634,200 | $268,200 | $366,000 |
| 2020 | $8,714 | $634,200 | $268,200 | $366,000 |
| 2019 | $8,505 | $634,200 | $268,200 | $366,000 |
| 2018 | $9,215 | $634,200 | $268,200 | $366,000 |
| 2017 | $7,173 | $502,300 | $212,100 | $290,200 |
| 2016 | $7,166 | $502,200 | $208,200 | $294,000 |
| 2015 | $6,563 | $456,100 | $204,900 | $251,200 |
Source: Public Records
Map
Nearby Homes
- 445 Salem St
- 45 Thistle Rd
- 88 Johnson St
- 61 Abbott St
- 71 Regency Place
- 447 Stevens St
- 3 Great Pond Rd
- 124 Quail Run Rd
- 136 Quail Run Rd
- 86 Andover St
- 42 Hewitt Ave
- 115 Mill Pond
- 10 Bridle Path
- 16 Court St
- 65 Saile Way
- 12 Mill Pond Unit 12
- 8 Fernview Ave Unit 5
- 19 Fernview Ave Unit 6
- 19 Fernview Ave Unit 5
- 141 Cortland Dr Unit 141
Your Personal Tour Guide
Ask me questions while you tour the home.