21 Arch St Malden, MA 02148
Linden NeighborhoodEstimated Value: $873,397 - $921,000
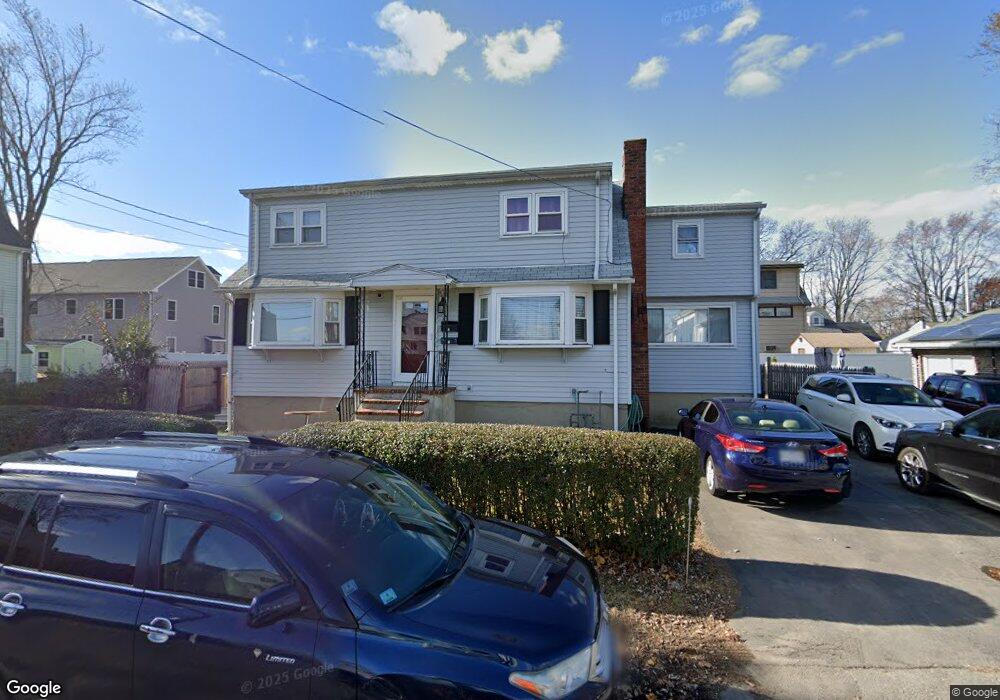
About This Home
This home is located at 21 Arch St, Malden, MA 02148 and is currently estimated at $904,849, approximately $499 per square foot. 21 Arch St is a home located in Middlesex County with nearby schools including Malden High School and Malden Catholic.
Ownership History
We collect this data history from publicly available records. To have your information removed, we recommend requesting removal directly through your county’s website.
Purchase Details
Purchase Details
Home Financials for this Owner
Home Financials are based on the most recent Mortgage that was taken out on this home.Purchase Details
Home Financials for this Owner
Home Financials are based on the most recent Mortgage that was taken out on this home.Home Values in the Area
Average Home Value in this Area
Purchase History
We collect this data history from publicly available records. To have your information removed, we recommend requesting removal directly through your county’s website.
| Date | Buyer | Sale Price | Title Company |
|---|---|---|---|
| -- | -- | ||
| $600,000 | -- | ||
| $355,000 | -- |
Mortgage History
We collect this data history from publicly available records. To have your information removed, we recommend requesting removal directly through your county’s website.
| Date | Status | Borrower | Loan Amount |
|---|---|---|---|
| Previous Owner | $450,000 | ||
| Previous Owner | $266,250 |
Tax History
We collect this data history from publicly available records. To have your information removed, we recommend requesting removal directly through your county’s website.
| Year | Tax Paid | Tax Assessment Tax Assessment Total Assessment is a certain percentage of the fair market value that is determined by local assessors to be the total taxable value of land and additions on the property. | Land | Improvement |
|---|---|---|---|---|
| 2025 | $82 | $726,000 | $283,500 | $442,500 |
| 2024 | $7,982 | $682,800 | $266,800 | $416,000 |
| 2023 | $7,707 | $632,200 | $241,800 | $390,400 |
| 2022 | $7,399 | $599,100 | $220,900 | $378,200 |
| 2021 | $7,209 | $586,600 | $208,400 | $378,200 |
| 2020 | $6,885 | $544,300 | $192,600 | $351,700 |
| 2019 | $5,442 | $410,100 | $183,400 | $226,700 |
| 2018 | $5,690 | $403,800 | $152,200 | $251,600 |
| 2017 | $4,995 | $352,500 | $152,200 | $200,300 |
| 2016 | $4,865 | $320,900 | $139,700 | $181,200 |
| 2015 | $4,757 | $302,400 | $133,000 | $169,400 |
| 2014 | $4,580 | $284,500 | $120,900 | $163,600 |
Map
- 14 Prentiss St
- 305 Lynn St
- 22 Davis St
- 145 Oliver St
- 33 Blaine St
- 38 Clapp St
- 292 Broadway
- 165 Central Ave
- 18 Fleming Rd
- 161 Webster St
- 39 Broadway Unit 305
- 26 Central Ave
- 131 Laurel St Unit C
- 131 Laurel St Unit C
- 123-125 Laurel St
- 50 Marshall St
- 29 Bowman St
- 17 Estes St
- 27 Pemberton St
- 79 Waite Street Extension Unit 45
Ask me questions while you tour the home.