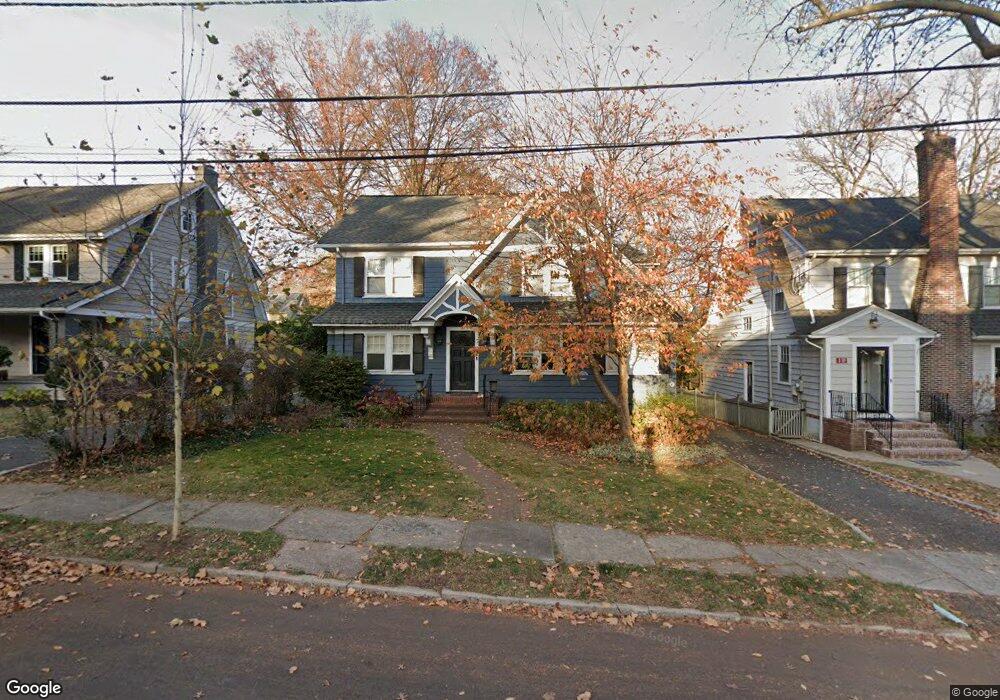
21 Arcularius Terrace Maplewood, NJ 07040
Estimated Value: $1,209,000 - $1,422,000
--
Bed
--
Bath
2,535
Sq Ft
$506/Sq Ft
Est. Value
About This Home
This home is located at 21 Arcularius Terrace, Maplewood, NJ 07040 and is currently estimated at $1,281,776, approximately $505 per square foot. 21 Arcularius Terrace is a home located in Essex County with nearby schools including Delia Bolden Elementary School, Maplewood Middle School, and Columbia Senior High School.
Ownership History
Date
Name
Owned For
Owner Type
Purchase Details
Closed on
May 22, 2008
Sold by
Hall William J and Hall Jacqueline M
Bought by
Song Daniel J and Song Allison B
Current Estimated Value
Home Financials for this Owner
Home Financials are based on the most recent Mortgage that was taken out on this home.
Original Mortgage
$417,000
Outstanding Balance
$267,107
Interest Rate
6.1%
Mortgage Type
Purchase Money Mortgage
Estimated Equity
$1,014,669
Purchase Details
Closed on
Feb 17, 2004
Sold by
Dahl Jonathan
Bought by
Hall William and Hall Jacqueline
Home Financials for this Owner
Home Financials are based on the most recent Mortgage that was taken out on this home.
Original Mortgage
$214,900
Interest Rate
5.65%
Purchase Details
Closed on
Jun 22, 1993
Sold by
Burt Sr James H and Burt Marleen M
Bought by
Dahl Jonathan and Dahl Jane
Create a Home Valuation Report for This Property
The Home Valuation Report is an in-depth analysis detailing your home's value as well as a comparison with similar homes in the area
Home Values in the Area
Average Home Value in this Area
Purchase History
| Date | Buyer | Sale Price | Title Company |
|---|---|---|---|
| Song Daniel J | $710,000 | None Available | |
| Hall William | $614,900 | -- | |
| Dahl Jonathan | $210,000 | -- |
Source: Public Records
Mortgage History
| Date | Status | Borrower | Loan Amount |
|---|---|---|---|
| Open | Song Daniel J | $417,000 | |
| Previous Owner | Hall William | $214,900 |
Source: Public Records
Tax History Compared to Growth
Tax History
| Year | Tax Paid | Tax Assessment Tax Assessment Total Assessment is a certain percentage of the fair market value that is determined by local assessors to be the total taxable value of land and additions on the property. | Land | Improvement |
|---|---|---|---|---|
| 2025 | $22,625 | $1,027,900 | $503,600 | $524,300 |
| 2024 | $22,625 | $1,027,900 | $503,600 | $524,300 |
| 2022 | $22,062 | $625,700 | $361,900 | $263,800 |
| 2021 | $21,393 | $625,700 | $361,900 | $263,800 |
| 2020 | $20,786 | $625,700 | $361,900 | $263,800 |
| 2019 | $20,185 | $625,700 | $361,900 | $263,800 |
| 2018 | $19,666 | $625,700 | $361,900 | $263,800 |
| 2017 | $19,078 | $625,700 | $361,900 | $263,800 |
| 2016 | $19,191 | $520,800 | $291,400 | $229,400 |
| 2015 | $18,749 | $520,800 | $291,400 | $229,400 |
| 2014 | $18,353 | $520,800 | $291,400 | $229,400 |
Source: Public Records
Map
Nearby Homes
- 73 Jefferson Ave
- 432 Walton Rd
- 8 Kendal Ave
- 2 Maplewood Ave
- 168 Wyoming Ave
- 311 Lenox Ave
- 66 Claremont Ave
- 28 Wesley Ct
- 23 Kensington Terrace
- 83 Hixon Place
- 609 W South Orange Ave
- 372 Valley St Unit 5F
- 609 So Orange Ave West5q Unit 5Q
- 14 Highland Place
- 118 Rynda Rd
- 161 Church St
- 11 Oakview Ave
- 551 Prospect St
- 15 4th St
- 448 Prospect St
- 19 Arcularius Terrace
- 23 Arcularius Terrace
- 17 Arcularius Terrace
- 25 Arcularius Terrace
- 22 de Hart Rd
- 20 de Hart Rd
- 16 de Hart Rd
- 15 Arcularius Terrace
- 27 Arcularius Terrace
- 26 de Hart Rd
- 22 Arcularius Terrace
- 24 Arcularius Terrace
- 14 de Hart Rd
- 20 Arcularius Terrace
- 26 Arcularius Terrace
- 28 de Hart Rd
- 18 Arcularius Terrace
- 28 Arcularius Terrace
- 53 Headley Place
- 13 Arcularius Terrace