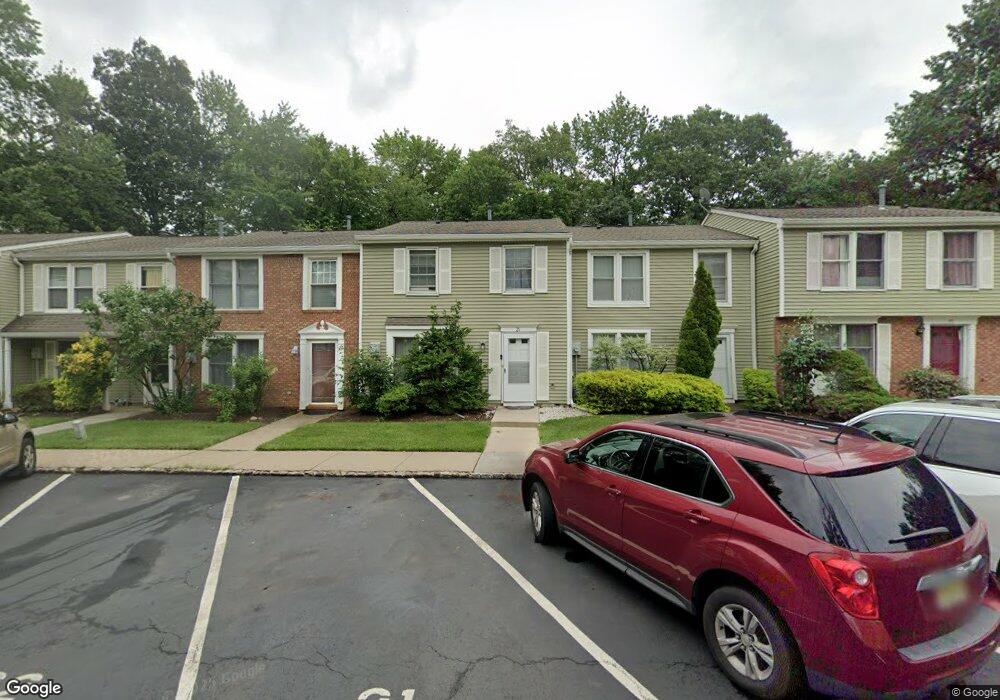
21 Aspen Ct Monmouth Junction, NJ 08852
Estimated Value: $378,000 - $397,000
3
Beds
3
Baths
1,280
Sq Ft
$304/Sq Ft
Est. Value
About This Home
This home is located at 21 Aspen Ct, Monmouth Junction, NJ 08852 and is currently estimated at $388,832, approximately $303 per square foot. 21 Aspen Ct is a home located in Middlesex County with nearby schools including Constable Elementary School, Crossroads North Middle School, and South Brunswick High School.
Ownership History
Date
Name
Owned For
Owner Type
Purchase Details
Closed on
Oct 6, 2015
Sold by
Bright Winsome
Bought by
Lall Balwant Singh and Kaur Harkamal Preet
Current Estimated Value
Purchase Details
Closed on
Apr 1, 2003
Sold by
Haq Zia Ul
Bought by
Bright Winsome
Home Financials for this Owner
Home Financials are based on the most recent Mortgage that was taken out on this home.
Original Mortgage
$140,800
Interest Rate
5.84%
Purchase Details
Closed on
Mar 31, 1999
Sold by
Baran William
Bought by
Haq Zia Ul
Home Financials for this Owner
Home Financials are based on the most recent Mortgage that was taken out on this home.
Original Mortgage
$97,500
Interest Rate
7.04%
Mortgage Type
FHA
Create a Home Valuation Report for This Property
The Home Valuation Report is an in-depth analysis detailing your home's value as well as a comparison with similar homes in the area
Home Values in the Area
Average Home Value in this Area
Purchase History
| Date | Buyer | Sale Price | Title Company |
|---|---|---|---|
| Lall Balwant Singh | $180,000 | Infinity Title Agency | |
| Bright Winsome | $176,000 | -- | |
| Haq Zia Ul | $100,000 | -- |
Source: Public Records
Mortgage History
| Date | Status | Borrower | Loan Amount |
|---|---|---|---|
| Previous Owner | Bright Winsome | $140,800 | |
| Previous Owner | Haq Zia Ul | $97,500 |
Source: Public Records
Tax History Compared to Growth
Tax History
| Year | Tax Paid | Tax Assessment Tax Assessment Total Assessment is a certain percentage of the fair market value that is determined by local assessors to be the total taxable value of land and additions on the property. | Land | Improvement |
|---|---|---|---|---|
| 2025 | $5,065 | $93,000 | $50,000 | $43,000 |
| 2024 | $4,883 | $93,000 | $50,000 | $43,000 |
| 2023 | $4,883 | $93,000 | $50,000 | $43,000 |
| 2022 | $4,739 | $93,000 | $50,000 | $43,000 |
| 2021 | $3,645 | $93,000 | $50,000 | $43,000 |
| 2020 | $4,765 | $93,000 | $50,000 | $43,000 |
| 2019 | $4,807 | $93,000 | $50,000 | $43,000 |
| 2018 | $4,650 | $93,000 | $50,000 | $43,000 |
| 2017 | $4,643 | $93,000 | $50,000 | $43,000 |
| 2016 | $4,593 | $93,000 | $50,000 | $43,000 |
| 2015 | $4,454 | $93,000 | $50,000 | $43,000 |
| 2014 | $4,382 | $93,000 | $50,000 | $43,000 |
Source: Public Records
Map
Nearby Homes