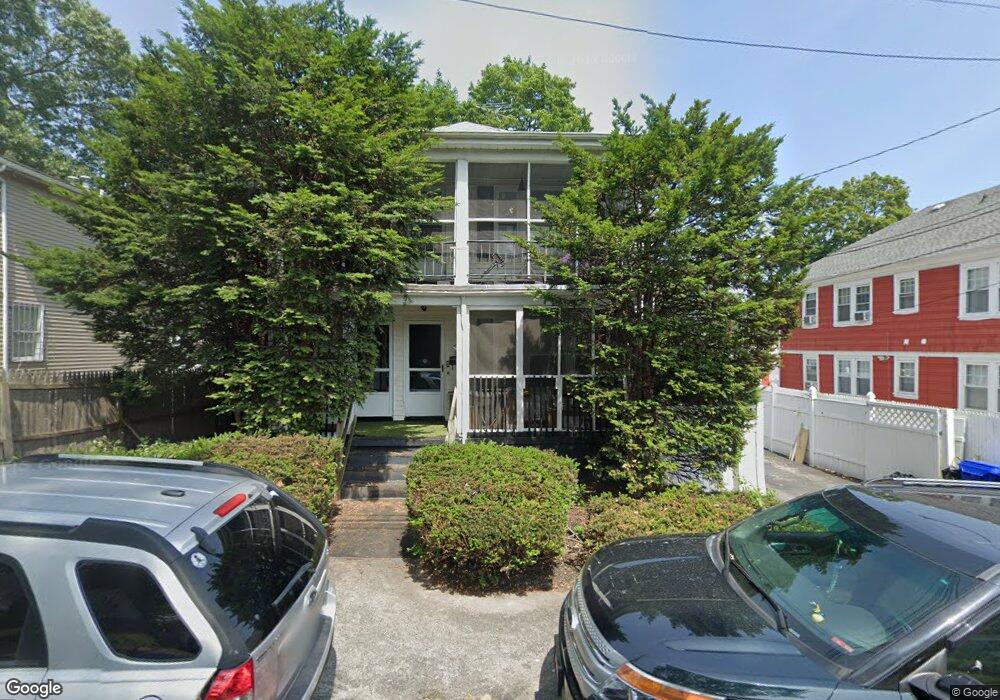
21 Atlas St Providence, RI 02904
Wanskuck NeighborhoodEstimated Value: $468,628 - $539,000
6
Beds
2
Baths
2,288
Sq Ft
$225/Sq Ft
Est. Value
About This Home
This home is located at 21 Atlas St, Providence, RI 02904 and is currently estimated at $514,407, approximately $224 per square foot. 21 Atlas St is a home located in Providence County with nearby schools including Asa Messer Elementary School, Charles N. Fortes Elementary School, and Veazie Street Elementary School.
Ownership History
Date
Name
Owned For
Owner Type
Purchase Details
Closed on
Jul 19, 1999
Sold by
Saceda Estela D
Bought by
Hazard Dorothy L
Current Estimated Value
Home Financials for this Owner
Home Financials are based on the most recent Mortgage that was taken out on this home.
Original Mortgage
$106,851
Outstanding Balance
$28,410
Interest Rate
7.39%
Mortgage Type
Purchase Money Mortgage
Estimated Equity
$485,997
Create a Home Valuation Report for This Property
The Home Valuation Report is an in-depth analysis detailing your home's value as well as a comparison with similar homes in the area
Home Values in the Area
Average Home Value in this Area
Purchase History
| Date | Buyer | Sale Price | Title Company |
|---|---|---|---|
| Hazard Dorothy L | $110,000 | -- |
Source: Public Records
Mortgage History
| Date | Status | Borrower | Loan Amount |
|---|---|---|---|
| Open | Hazard Dorothy L | $106,851 |
Source: Public Records
Tax History Compared to Growth
Tax History
| Year | Tax Paid | Tax Assessment Tax Assessment Total Assessment is a certain percentage of the fair market value that is determined by local assessors to be the total taxable value of land and additions on the property. | Land | Improvement |
|---|---|---|---|---|
| 2025 | $3,749 | $496,500 | $166,100 | $330,400 |
| 2024 | $5,903 | $321,700 | $91,100 | $230,600 |
| 2023 | $5,903 | $321,700 | $91,100 | $230,600 |
| 2022 | $5,726 | $321,700 | $91,100 | $230,600 |
| 2021 | $4,590 | $186,900 | $48,300 | $138,600 |
| 2020 | $4,590 | $186,900 | $48,300 | $138,600 |
| 2019 | $4,590 | $186,900 | $48,300 | $138,600 |
| 2018 | $4,155 | $130,000 | $41,000 | $89,000 |
| 2017 | $4,155 | $130,000 | $41,000 | $89,000 |
| 2016 | $4,155 | $130,000 | $41,000 | $89,000 |
| 2015 | $3,800 | $114,800 | $41,000 | $73,800 |
| 2014 | $3,875 | $114,800 | $41,000 | $73,800 |
| 2013 | $3,875 | $114,800 | $41,000 | $73,800 |
Source: Public Records
Map
Nearby Homes
- 1014 Douglas Ave
- 31 Joseph St
- 65 General St
- 22 General St
- 1117 Douglas Ave Unit 115
- 115 Hazael St
- 80 Lubec St
- 60 Hazael St
- 41 Henrietta St
- 6 Utter St
- 874 Branch Ave
- 860 Douglas Ave
- 272 Veazie St
- 252 Gentian Ave
- 507 Sharon St
- 73 Wainwright St
- 0 Wainwright St
- 10 Burleigh St Unit 9
- 825 Douglas Ave
- 69 Cushing St