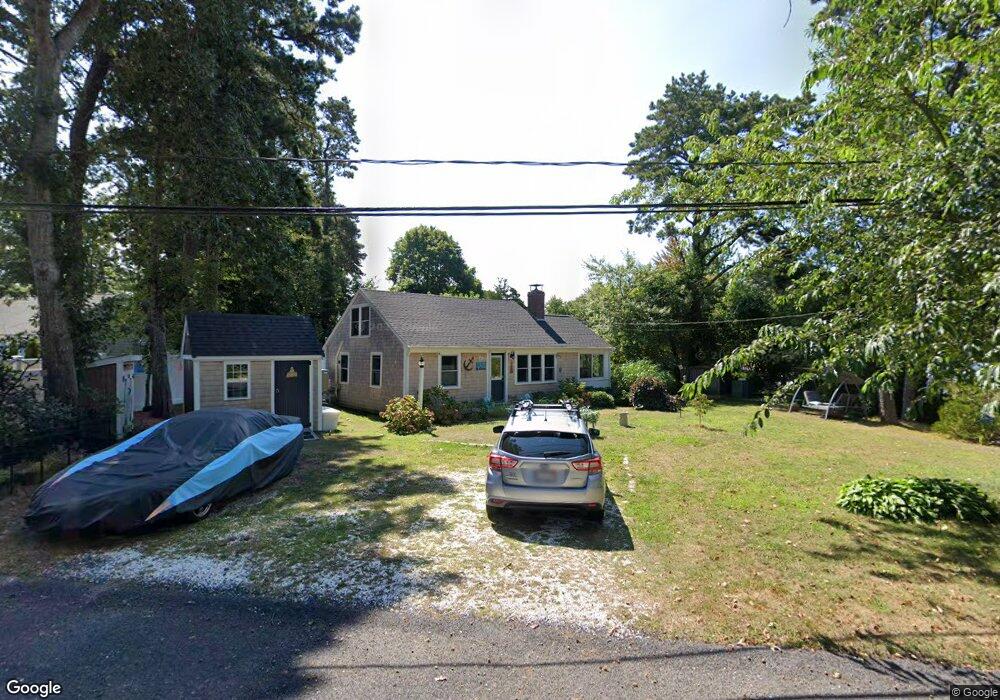
21 Azalea Ln Unit 1 South Yarmouth, MA 02664
South Yarmouth NeighborhoodEstimated Value: $518,000 - $549,000
2
Beds
1
Bath
1,038
Sq Ft
$512/Sq Ft
Est. Value
About This Home
This home is located at 21 Azalea Ln Unit 1, South Yarmouth, MA 02664 and is currently estimated at $531,830, approximately $512 per square foot. 21 Azalea Ln Unit 1 is a home located in Barnstable County with nearby schools including Dennis-Yarmouth Regional High School and St. Pius X. School.
Ownership History
Date
Name
Owned For
Owner Type
Purchase Details
Closed on
Jan 7, 2022
Sold by
Maxwell Glenn and Maxwell Jennifer
Bought by
L Wallace 2021 T J
Current Estimated Value
Home Financials for this Owner
Home Financials are based on the most recent Mortgage that was taken out on this home.
Original Mortgage
$372,186
Outstanding Balance
$341,656
Interest Rate
3.12%
Mortgage Type
Purchase Money Mortgage
Estimated Equity
$190,174
Purchase Details
Closed on
Nov 17, 2014
Sold by
Fnma
Bought by
Maxwell Glenn and Maxwell Jennifer
Purchase Details
Closed on
Oct 29, 2014
Sold by
Allen George B and Nationstar Mortgage Ll
Bought by
Fnma
Purchase Details
Closed on
Sep 22, 2008
Sold by
Allen George Bedford
Bought by
Allen George Bedford and Capobianco Joseph
Home Financials for this Owner
Home Financials are based on the most recent Mortgage that was taken out on this home.
Original Mortgage
$123,500
Interest Rate
6.54%
Mortgage Type
Purchase Money Mortgage
Create a Home Valuation Report for This Property
The Home Valuation Report is an in-depth analysis detailing your home's value as well as a comparison with similar homes in the area
Home Values in the Area
Average Home Value in this Area
Purchase History
| Date | Buyer | Sale Price | Title Company |
|---|---|---|---|
| L Wallace 2021 T J | $414,000 | None Available | |
| Maxwell Glenn | $158,100 | -- | |
| Maxwell Glenn | $158,100 | -- | |
| Fnma | $154,867 | -- | |
| Fnma | $154,867 | -- | |
| Allen George Bedford | -- | -- | |
| Allen George Bedford | $115,000 | -- | |
| Allen George Bedford | -- | -- | |
| Allen George Bedford | $115,000 | -- |
Source: Public Records
Mortgage History
| Date | Status | Borrower | Loan Amount |
|---|---|---|---|
| Open | L Wallace 2021 T J | $372,186 | |
| Previous Owner | Allen George Bedford | $123,500 |
Source: Public Records
Tax History Compared to Growth
Tax History
| Year | Tax Paid | Tax Assessment Tax Assessment Total Assessment is a certain percentage of the fair market value that is determined by local assessors to be the total taxable value of land and additions on the property. | Land | Improvement |
|---|---|---|---|---|
| 2025 | $2,831 | $399,900 | $143,300 | $256,600 |
| 2024 | $2,617 | $354,600 | $124,600 | $230,000 |
| 2023 | $2,401 | $296,100 | $113,300 | $182,800 |
| 2022 | $2,255 | $245,600 | $108,100 | $137,500 |
| 2021 | $2,235 | $233,800 | $108,100 | $125,700 |
| 2020 | $2,247 | $224,700 | $114,400 | $110,300 |
| 2019 | $2,132 | $211,100 | $114,400 | $96,700 |
| 2018 | $1,976 | $192,000 | $95,300 | $96,700 |
| 2017 | $1,924 | $192,000 | $95,300 | $96,700 |
| 2016 | $1,840 | $184,400 | $87,700 | $96,700 |
| 2015 | $1,715 | $170,800 | $83,900 | $86,900 |
Source: Public Records
Map
Nearby Homes
- 17 Fairmount Rd
- 17 Fairmount Rd
- 129 Driftwood Ln
- 118 Driftwood Ln
- 7 Vinland Dr
- 62 Old Fish House Rd
- 10 Joanne Dr
- 85 Keel Cape Dr
- 26 Olivia Walker Way
- 4 Old Colony Way
- 25 Skerry Rd
- 6 Hawthorn St
- 1 Norseman Dr
- 17 Margate Ln
- 153 Bayridge Dr
- 4 Ebb Rd
- 91 Chipping Green Cir
- 11 Uncle Stanleys Way
- 111 Merchant Ave
- 15 Captain Jud Rd
- 21 Azalea Ln
- 21 Azalea Ln
- 13 Azalea Ln
- 34 Wildrose Terrace
- 30 Wildrose Terrace
- 35 Wildrose Terrace
- 20 Azalea Ln
- 29 Wildrose Terrace
- 16 Azalea Ln
- 39 Wildrose Terrace
- 11 Azalea Ln
- 16 Wildrose Terrace
- 0 Wildrose Terrace
- 97 Mayflower Terrace
- 17 Buttercup Ln
- 95 Mayflower Terrace
- 12 Azalea Ln
- 24 Wildrose Terrace
- 101 Mayflower Terrace
- 89 Mayflower Terrace