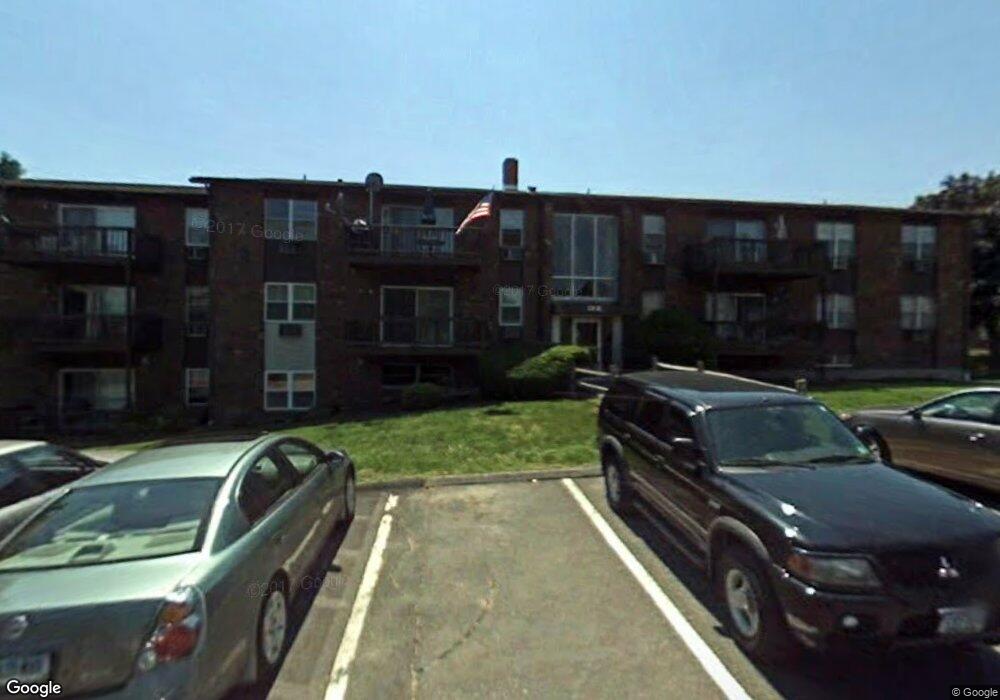
21 Balance Rock Rd Unit 16 Seymour, CT 06483
Estimated Value: $194,683 - $241,000
2
Beds
1
Bath
900
Sq Ft
$235/Sq Ft
Est. Value
About This Home
This home is located at 21 Balance Rock Rd Unit 16, Seymour, CT 06483 and is currently estimated at $211,421, approximately $234 per square foot. 21 Balance Rock Rd Unit 16 is a home located in New Haven County with nearby schools including Bungay Elementary School, Seymour Middle School, and Seymour High School.
Ownership History
Date
Name
Owned For
Owner Type
Purchase Details
Closed on
Nov 4, 2008
Sold by
Stan Jacek R
Bought by
Koniarz Marek T and Koniarz Wioletta B
Current Estimated Value
Home Financials for this Owner
Home Financials are based on the most recent Mortgage that was taken out on this home.
Original Mortgage
$139,500
Interest Rate
5.83%
Purchase Details
Closed on
Jun 7, 2005
Sold by
Rowan Jeremy W and Humphrey-Rowan Janelle
Bought by
Stan Jack R
Home Financials for this Owner
Home Financials are based on the most recent Mortgage that was taken out on this home.
Original Mortgage
$135,703
Interest Rate
8.49%
Purchase Details
Closed on
Jun 17, 1996
Sold by
Pilgrim Mortgage Corp
Bought by
Czajkowska Danuta
Home Financials for this Owner
Home Financials are based on the most recent Mortgage that was taken out on this home.
Original Mortgage
$25,000
Interest Rate
7.97%
Mortgage Type
Unknown
Create a Home Valuation Report for This Property
The Home Valuation Report is an in-depth analysis detailing your home's value as well as a comparison with similar homes in the area
Home Values in the Area
Average Home Value in this Area
Purchase History
| Date | Buyer | Sale Price | Title Company |
|---|---|---|---|
| Koniarz Marek T | $152,500 | -- | |
| Stan Jack R | $139,900 | -- | |
| Czajkowska Danuta | $50,000 | -- |
Source: Public Records
Mortgage History
| Date | Status | Borrower | Loan Amount |
|---|---|---|---|
| Closed | Czajkowska Danuta | $141,000 | |
| Closed | Czajkowska Danuta | $139,500 | |
| Previous Owner | Czajkowska Danuta | $135,703 | |
| Previous Owner | Czajkowska Danuta | $25,000 |
Source: Public Records
Tax History Compared to Growth
Tax History
| Year | Tax Paid | Tax Assessment Tax Assessment Total Assessment is a certain percentage of the fair market value that is determined by local assessors to be the total taxable value of land and additions on the property. | Land | Improvement |
|---|---|---|---|---|
| 2025 | $3,254 | $117,390 | $0 | $117,390 |
| 2024 | $2,651 | $71,960 | $0 | $71,960 |
| 2023 | $2,589 | $71,960 | $0 | $71,960 |
| 2022 | $2,561 | $71,960 | $0 | $71,960 |
| 2021 | $2,498 | $71,960 | $0 | $71,960 |
| 2020 | $2,301 | $63,910 | $0 | $63,910 |
| 2019 | $2,301 | $63,910 | $0 | $63,910 |
| 2018 | $2,301 | $63,910 | $0 | $63,910 |
| 2017 | $2,301 | $63,910 | $0 | $63,910 |
| 2016 | $2,301 | $63,910 | $0 | $63,910 |
| 2015 | $2,412 | $69,720 | $0 | $69,720 |
| 2014 | -- | $69,720 | $0 | $69,720 |
Source: Public Records
Map
Nearby Homes
- 37-14, 49-1, 79-2, 7 Balance Rock Rd
- 41 Balance Rock Rd Unit 16
- 93 Balance Rock Rd Unit 1
- 36 Bungay Terrace
- 3 Deer Run Dr
- 50 Bissell Place
- 68 New St
- 6 Stanley Dr
- 22 Frances Dr
- 36 Kathy Dr
- 169 Derby Ave
- 21 Stanley Dr
- 11 Oxford Rd
- 56 Kathy Dr
- 148 Bungay Rd
- 26-28 S Main St
- 61 Pershing Ave
- 106 Botsford Rd
- 98 Great Hill Rd
- 22 Brookfield Rd
- 21 Balance Rock Rd Unit 15
- 21 Balance Rock Rd Unit 14
- 21 Balance Rock Rd Unit 11
- 21 Balance Rock Rd Unit 6
- 21 Balance Rock Rd Unit 2
- 21 Balance Rock Rd Unit 10
- 21 Balance Rock Rd Unit 7
- 21 Balance Rock Rd Unit 12
- 21 Balance Rock Rd Unit 17
- 21 Balance Rock Rd Unit 8
- 21 Balance Rock Rd Unit 3
- 21 Balance Rock Rd Unit 5
- 21 Balance Rock Rd Unit 1
- 21 Balance Rock Rd Unit 4
- 21 Balance Rock Rd Unit 9
- 21 Balance Rock Rd
- 25 Balance Rock Rd Unit 9
- 25 Balance Rock Rd Unit 17
- 25 Balance Rock Rd Unit 12
- 25 Balance Rock Rd Unit 11