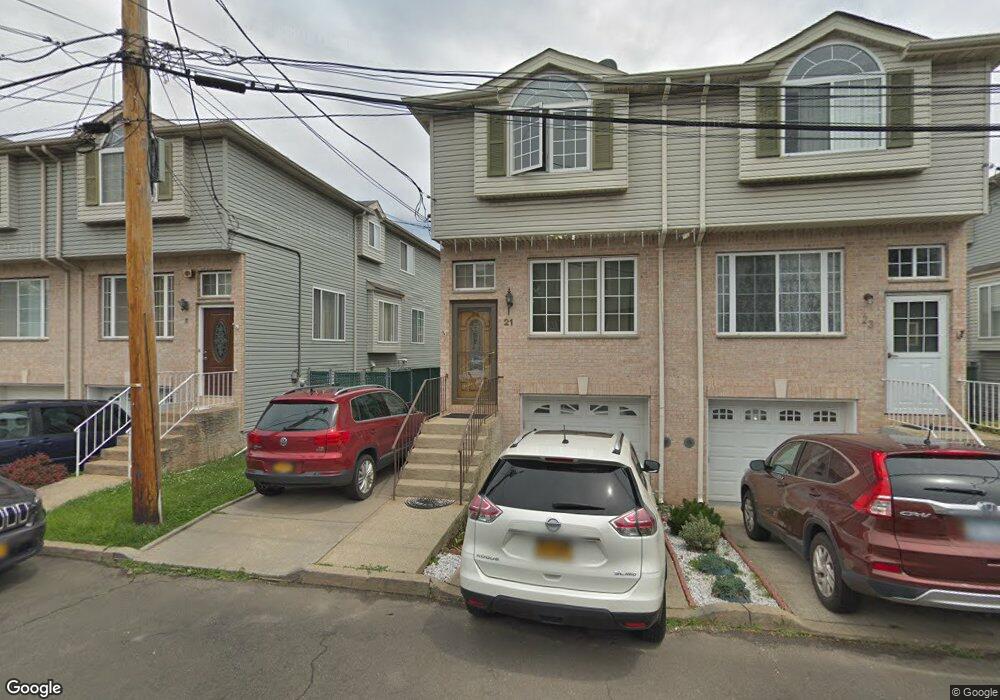
21 Barry Ct Staten Island, NY 10306
Oakwood NeighborhoodEstimated Value: $708,299 - $796,000
4
Beds
3
Baths
1,300
Sq Ft
$579/Sq Ft
Est. Value
About This Home
This home is located at 21 Barry Ct, Staten Island, NY 10306 and is currently estimated at $752,825, approximately $579 per square foot. 21 Barry Ct is a home located in Richmond County with nearby schools including P.S. 50 Frank Hankinson School, Myra S. Barnes Intermediate School 24, and New Dorp High School.
Ownership History
Date
Name
Owned For
Owner Type
Purchase Details
Closed on
Dec 15, 1998
Sold by
Three Zs Building Corp
Bought by
Kogan Yevgeny and Belzer Lyudmila
Current Estimated Value
Home Financials for this Owner
Home Financials are based on the most recent Mortgage that was taken out on this home.
Original Mortgage
$213,750
Interest Rate
6.67%
Mortgage Type
Purchase Money Mortgage
Purchase Details
Closed on
Mar 12, 1998
Sold by
L & M Holding Corp
Bought by
Three Zs Building Corp
Create a Home Valuation Report for This Property
The Home Valuation Report is an in-depth analysis detailing your home's value as well as a comparison with similar homes in the area
Home Values in the Area
Average Home Value in this Area
Purchase History
| Date | Buyer | Sale Price | Title Company |
|---|---|---|---|
| Kogan Yevgeny | $225,000 | Fidelity National Title Ins | |
| Three Zs Building Corp | $182,500 | -- |
Source: Public Records
Mortgage History
| Date | Status | Borrower | Loan Amount |
|---|---|---|---|
| Previous Owner | Kogan Yevgeny | $213,750 |
Source: Public Records
Tax History Compared to Growth
Tax History
| Year | Tax Paid | Tax Assessment Tax Assessment Total Assessment is a certain percentage of the fair market value that is determined by local assessors to be the total taxable value of land and additions on the property. | Land | Improvement |
|---|---|---|---|---|
| 2025 | $5,885 | $40,560 | $5,994 | $34,566 |
| 2024 | $6,166 | $34,200 | $7,055 | $27,145 |
| 2023 | $5,597 | $28,961 | $5,855 | $23,106 |
| 2022 | $5,167 | $37,620 | $7,860 | $29,760 |
| 2021 | $5,122 | $31,260 | $7,860 | $23,400 |
| 2020 | $5,160 | $30,060 | $7,860 | $22,200 |
| 2019 | $5,059 | $28,680 | $7,860 | $20,820 |
| 2018 | $4,622 | $24,134 | $6,628 | $17,506 |
| 2017 | $4,342 | $22,768 | $7,152 | $15,616 |
| 2016 | $3,984 | $21,480 | $7,860 | $13,620 |
| 2015 | $3,840 | $21,600 | $6,540 | $15,060 |
| 2014 | $3,840 | $21,600 | $6,540 | $15,060 |
Source: Public Records
Map
Nearby Homes