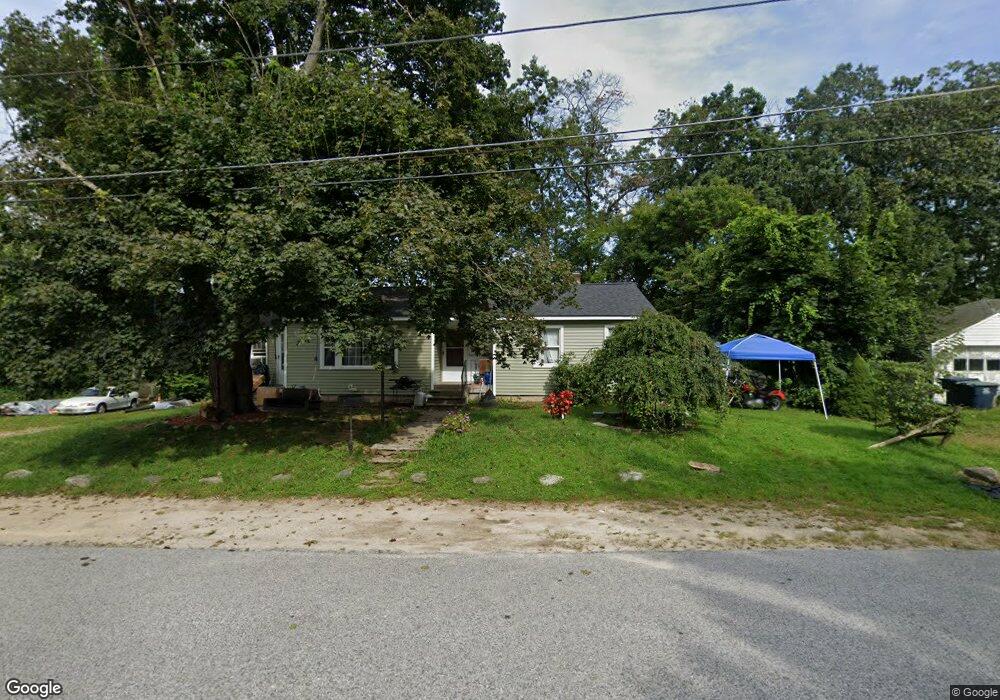
21 Batten St Unit 1 Webster, MA 01570
Estimated Value: $319,923 - $371,000
3
Beds
1
Bath
956
Sq Ft
$367/Sq Ft
Est. Value
About This Home
This home is located at 21 Batten St Unit 1, Webster, MA 01570 and is currently estimated at $350,731, approximately $366 per square foot. 21 Batten St Unit 1 is a home located in Worcester County with nearby schools including Park Avenue Elementary School, Webster Middle School, and Bartlett High School.
Ownership History
Date
Name
Owned For
Owner Type
Purchase Details
Closed on
May 22, 2009
Sold by
Zonia Wendy L
Bought by
Crompton Mitchell and Desautels Janelle N
Current Estimated Value
Home Financials for this Owner
Home Financials are based on the most recent Mortgage that was taken out on this home.
Original Mortgage
$139,918
Outstanding Balance
$88,783
Interest Rate
4.93%
Mortgage Type
Purchase Money Mortgage
Estimated Equity
$261,948
Purchase Details
Closed on
Nov 1, 1996
Sold by
Javaras Betty and Gould Gloria
Bought by
Zonia Wendy L
Create a Home Valuation Report for This Property
The Home Valuation Report is an in-depth analysis detailing your home's value as well as a comparison with similar homes in the area
Home Values in the Area
Average Home Value in this Area
Purchase History
| Date | Buyer | Sale Price | Title Company |
|---|---|---|---|
| Crompton Mitchell | $142,500 | -- | |
| Zonia Wendy L | $65,000 | -- |
Source: Public Records
Mortgage History
| Date | Status | Borrower | Loan Amount |
|---|---|---|---|
| Open | Crompton Mitchell | $139,918 | |
| Previous Owner | Zonia Wendy L | $115,200 | |
| Previous Owner | Zonia Wendy L | $12,000 |
Source: Public Records
Tax History
| Year | Tax Paid | Tax Assessment Tax Assessment Total Assessment is a certain percentage of the fair market value that is determined by local assessors to be the total taxable value of land and additions on the property. | Land | Improvement |
|---|---|---|---|---|
| 2025 | $2,407 | $202,600 | $56,600 | $146,000 |
| 2024 | $2,374 | $194,900 | $54,400 | $140,500 |
| 2023 | $2,158 | $172,600 | $51,800 | $120,800 |
| 2022 | $2,123 | $152,100 | $50,300 | $101,800 |
| 2021 | $2,093 | $138,600 | $50,300 | $88,300 |
| 2020 | $2,047 | $135,900 | $50,300 | $85,600 |
| 2019 | $1,952 | $127,300 | $50,300 | $77,000 |
| 2018 | $1,802 | $117,100 | $48,000 | $69,100 |
| 2017 | $1,737 | $114,800 | $47,100 | $67,700 |
| 2016 | $1,667 | $110,100 | $44,800 | $65,300 |
| 2015 | $1,584 | $107,900 | $43,900 | $64,000 |
Source: Public Records
Map
Nearby Homes
Your Personal Tour Guide
Ask me questions while you tour the home.