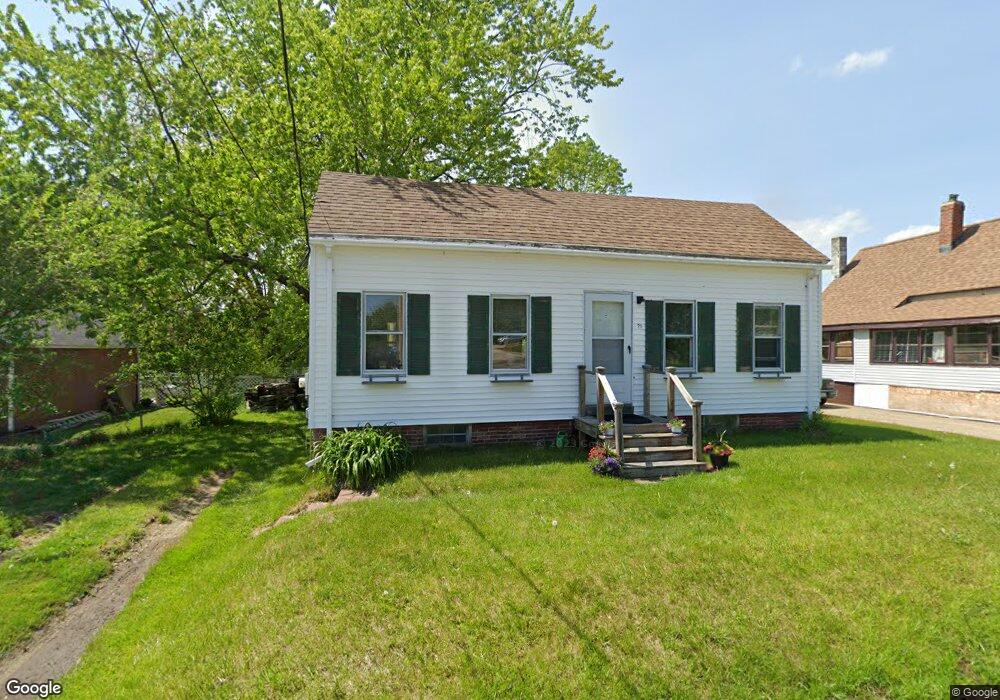
21 Bell St Berwick, ME 03901
Estimated Value: $235,000 - $352,000
1
Bed
1
Bath
512
Sq Ft
$562/Sq Ft
Est. Value
About This Home
This home is located at 21 Bell St, Berwick, ME 03901 and is currently estimated at $287,983, approximately $562 per square foot. 21 Bell St is a home located in York County with nearby schools including Noble High School and Tri-City Christian Academy.
Ownership History
Date
Name
Owned For
Owner Type
Purchase Details
Closed on
Sep 2, 2005
Sold by
Caron Rosaire W
Bought by
Glynn 3Rd Thomas L
Current Estimated Value
Home Financials for this Owner
Home Financials are based on the most recent Mortgage that was taken out on this home.
Original Mortgage
$984,000
Interest Rate
5.81%
Mortgage Type
Purchase Money Mortgage
Create a Home Valuation Report for This Property
The Home Valuation Report is an in-depth analysis detailing your home's value as well as a comparison with similar homes in the area
Home Values in the Area
Average Home Value in this Area
Purchase History
| Date | Buyer | Sale Price | Title Company |
|---|---|---|---|
| Glynn 3Rd Thomas L | -- | -- | |
| Glynn 3Rd Thomas L | -- | -- | |
| Glynn 3Rd Thomas L | -- | -- |
Source: Public Records
Mortgage History
| Date | Status | Borrower | Loan Amount |
|---|---|---|---|
| Closed | Glynn 3Rd Thomas L | $984,000 |
Source: Public Records
Tax History
| Year | Tax Paid | Tax Assessment Tax Assessment Total Assessment is a certain percentage of the fair market value that is determined by local assessors to be the total taxable value of land and additions on the property. | Land | Improvement |
|---|---|---|---|---|
| 2025 | $2,775 | $212,800 | $105,700 | $107,100 |
| 2024 | $2,659 | $213,200 | $105,700 | $107,500 |
| 2023 | $2,603 | $142,100 | $75,500 | $66,600 |
| 2022 | $2,624 | $144,000 | $75,500 | $68,500 |
| 2021 | $2,635 | $144,000 | $75,500 | $68,500 |
| 2020 | $2,798 | $144,500 | $75,500 | $69,000 |
| 2019 | $2,533 | $144,500 | $75,500 | $69,000 |
| 2018 | $2,290 | $130,100 | $68,900 | $61,200 |
| 2017 | $2,231 | $130,100 | $68,900 | $61,200 |
| 2016 | $2,186 | $134,100 | $68,900 | $65,200 |
| 2014 | $2,132 | $134,100 | $68,900 | $65,200 |
| 2013 | $2,152 | $134,100 | $68,900 | $65,200 |
Source: Public Records
Map
Nearby Homes
Your Personal Tour Guide
Ask me questions while you tour the home.