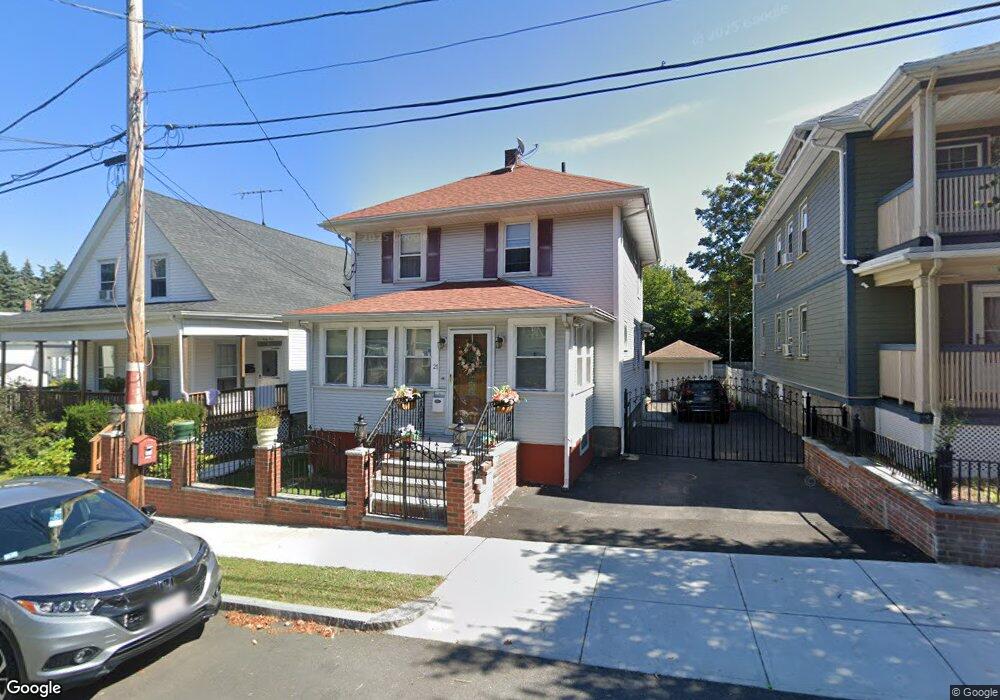
21 Berry St Quincy, MA 02169
Quincy Point NeighborhoodEstimated Value: $615,000 - $776,000
3
Beds
2
Baths
1,136
Sq Ft
$601/Sq Ft
Est. Value
About This Home
This home is located at 21 Berry St, Quincy, MA 02169 and is currently estimated at $682,420, approximately $600 per square foot. 21 Berry St is a home located in Norfolk County with nearby schools including Point Webster Middle School, Clifford H. Marshall Elementary School, and Quincy High School.
Ownership History
Date
Name
Owned For
Owner Type
Purchase Details
Closed on
Apr 25, 2025
Sold by
Luy Marites F
Bought by
21 Berry Street Rt and Luy
Current Estimated Value
Purchase Details
Closed on
Jul 21, 2003
Sold by
Caruso Richard D
Bought by
Luy Richard and Luy Marites F
Home Financials for this Owner
Home Financials are based on the most recent Mortgage that was taken out on this home.
Original Mortgage
$273,600
Interest Rate
5.34%
Mortgage Type
Purchase Money Mortgage
Purchase Details
Closed on
Jun 18, 1999
Sold by
Caruso C John C and Caruso Robert J
Bought by
Caruso Richard D
Home Financials for this Owner
Home Financials are based on the most recent Mortgage that was taken out on this home.
Original Mortgage
$100,000
Interest Rate
6.99%
Mortgage Type
Purchase Money Mortgage
Create a Home Valuation Report for This Property
The Home Valuation Report is an in-depth analysis detailing your home's value as well as a comparison with similar homes in the area
Home Values in the Area
Average Home Value in this Area
Purchase History
| Date | Buyer | Sale Price | Title Company |
|---|---|---|---|
| 21 Berry Street Rt | -- | None Available | |
| 21 Berry Street Rt | -- | None Available | |
| Luy Richard | $304,000 | -- | |
| Luy Richard | $304,000 | -- | |
| Caruso Richard D | $175,000 | -- |
Source: Public Records
Mortgage History
| Date | Status | Borrower | Loan Amount |
|---|---|---|---|
| Previous Owner | Caruso Richard D | $233,500 | |
| Previous Owner | Luy Richard | $273,600 | |
| Previous Owner | Caruso Richard D | $100,000 |
Source: Public Records
Tax History Compared to Growth
Tax History
| Year | Tax Paid | Tax Assessment Tax Assessment Total Assessment is a certain percentage of the fair market value that is determined by local assessors to be the total taxable value of land and additions on the property. | Land | Improvement |
|---|---|---|---|---|
| 2025 | $6,018 | $521,900 | $258,000 | $263,900 |
| 2024 | $5,686 | $504,500 | $245,700 | $258,800 |
| 2023 | $5,171 | $464,600 | $223,300 | $241,300 |
| 2022 | $5,072 | $423,400 | $203,000 | $220,400 |
| 2021 | $5,045 | $415,600 | $203,000 | $212,600 |
| 2020 | $4,674 | $376,000 | $191,500 | $184,500 |
| 2019 | $4,439 | $353,700 | $177,400 | $176,300 |
| 2018 | $4,075 | $305,500 | $161,200 | $144,300 |
| 2017 | $4,033 | $284,600 | $153,500 | $131,100 |
| 2016 | $3,787 | $263,700 | $139,600 | $124,100 |
| 2015 | $3,589 | $245,800 | $131,700 | $114,100 |
| 2014 | $3,525 | $237,200 | $131,700 | $105,500 |
Source: Public Records
Map
Nearby Homes
- 33 Elm St
- 2 Cliveden St Unit 601E
- 2 Cliveden St Unit 405E
- 81-85 Water St
- 18 Cliveden St Unit 406W
- 18 Cliveden St Unit 201W
- 16 Dartmouth St Unit 16
- 32 Sumner St
- 187 Washington St
- 166 Phipps St
- 51 Sumner St
- 106 Washington St Unit 45
- 50 N Payne St Unit 1
- 50 N Payne St Unit 3
- 59 Spear St Unit 302
- 59 Spear St Unit 301
- 59 Spear St Unit 202
- 66 Mcgrath Hwy Unit 407
- 66 Mcgrath Hwy Unit 405
- 66 Mcgrath Hwy Unit 308