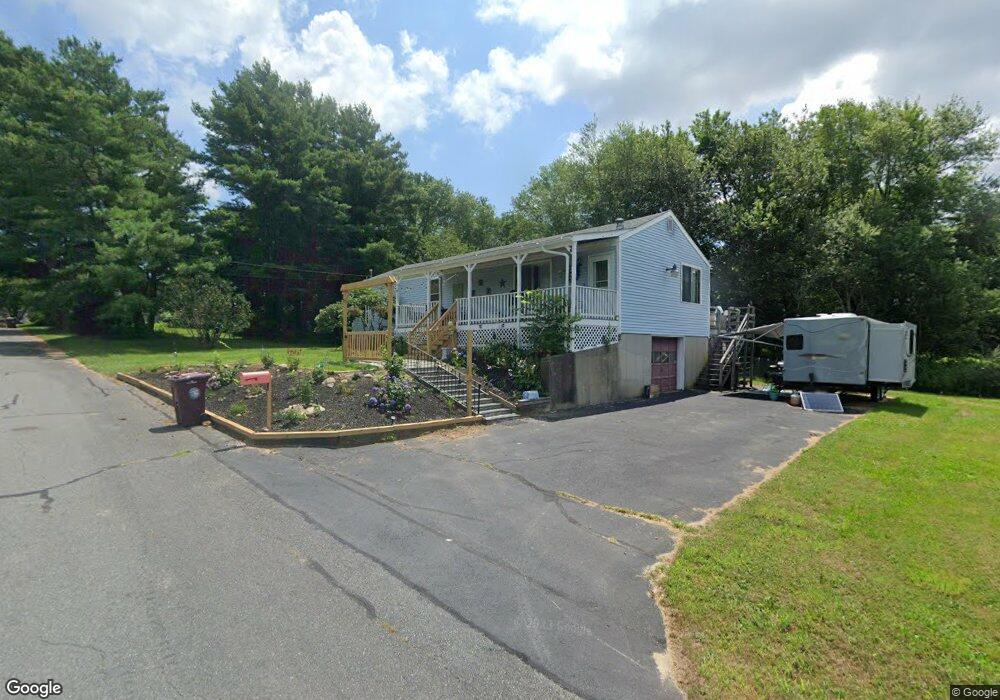
21 Blain St Acushnet, MA 02743
Upper Acushnet NeighborhoodEstimated Value: $407,000 - $481,819
2
Beds
1
Bath
1,368
Sq Ft
$318/Sq Ft
Est. Value
About This Home
This home is located at 21 Blain St, Acushnet, MA 02743 and is currently estimated at $435,205, approximately $318 per square foot. 21 Blain St is a home located in Bristol County with nearby schools including Acushnet Elementary School, Albert F Ford Middle School, and Alma Del Mar Charter School.
Ownership History
Date
Name
Owned For
Owner Type
Purchase Details
Closed on
Aug 12, 2019
Sold by
Paulette & J Beaulieu Ft
Bought by
Mccarthy William P
Current Estimated Value
Home Financials for this Owner
Home Financials are based on the most recent Mortgage that was taken out on this home.
Original Mortgage
$200,000
Outstanding Balance
$175,271
Interest Rate
3.73%
Mortgage Type
New Conventional
Estimated Equity
$259,934
Create a Home Valuation Report for This Property
The Home Valuation Report is an in-depth analysis detailing your home's value as well as a comparison with similar homes in the area
Home Values in the Area
Average Home Value in this Area
Purchase History
| Date | Buyer | Sale Price | Title Company |
|---|---|---|---|
| Mccarthy William P | $250,000 | -- |
Source: Public Records
Mortgage History
| Date | Status | Borrower | Loan Amount |
|---|---|---|---|
| Open | Mccarthy William P | $200,000 |
Source: Public Records
Tax History
| Year | Tax Paid | Tax Assessment Tax Assessment Total Assessment is a certain percentage of the fair market value that is determined by local assessors to be the total taxable value of land and additions on the property. | Land | Improvement |
|---|---|---|---|---|
| 2025 | $41 | $381,200 | $134,800 | $246,400 |
| 2024 | $4,053 | $355,200 | $128,500 | $226,700 |
| 2023 | $3,932 | $327,700 | $116,000 | $211,700 |
| 2022 | $3,954 | $298,000 | $110,000 | $188,000 |
| 2021 | $3,859 | $279,000 | $110,000 | $169,000 |
| 2020 | $3,889 | $279,000 | $110,000 | $169,000 |
| 2019 | $3,663 | $258,300 | $98,000 | $160,300 |
| 2018 | $3,563 | $247,100 | $98,000 | $149,100 |
| 2017 | $3,463 | $239,800 | $98,000 | $141,800 |
| 2016 | $3,419 | $235,300 | $98,000 | $137,300 |
| 2015 | $3,259 | $228,200 | $98,000 | $130,200 |
Source: Public Records
Map
Nearby Homes
Your Personal Tour Guide
Ask me questions while you tour the home.