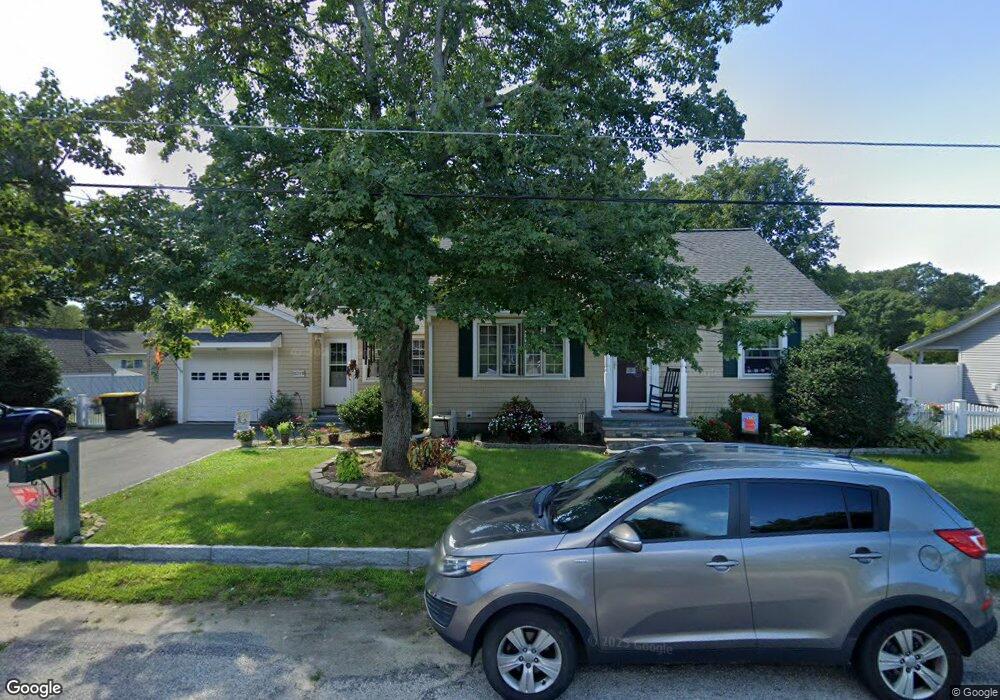
21 Bliss Rd Bellingham, MA 02019
Estimated Value: $539,731 - $609,000
4
Beds
3
Baths
2,240
Sq Ft
$256/Sq Ft
Est. Value
About This Home
This home is located at 21 Bliss Rd, Bellingham, MA 02019 and is currently estimated at $573,183, approximately $255 per square foot. 21 Bliss Rd is a home located in Norfolk County with nearby schools including Joseph F. DiPietro Elementary, Bellingham High School, and Mount Saint Charles Academy.
Ownership History
Date
Name
Owned For
Owner Type
Purchase Details
Closed on
Sep 11, 2025
Sold by
Harrington Todd P and Harrington Britt E
Bought by
Harrington Ft and Harrington
Current Estimated Value
Purchase Details
Closed on
Jun 15, 1995
Sold by
Sudlahian Gulenia
Bought by
Travis Britt E
Home Financials for this Owner
Home Financials are based on the most recent Mortgage that was taken out on this home.
Original Mortgage
$123,057
Interest Rate
8.24%
Mortgage Type
Purchase Money Mortgage
Create a Home Valuation Report for This Property
The Home Valuation Report is an in-depth analysis detailing your home's value as well as a comparison with similar homes in the area
Home Values in the Area
Average Home Value in this Area
Purchase History
| Date | Buyer | Sale Price | Title Company |
|---|---|---|---|
| Harrington Ft | -- | -- | |
| Travis Britt E | $123,900 | -- | |
| Travis Britt E | $123,900 | -- |
Source: Public Records
Mortgage History
| Date | Status | Borrower | Loan Amount |
|---|---|---|---|
| Previous Owner | Travis Britt E | $20,000 | |
| Previous Owner | Travis Britt E | $122,000 | |
| Previous Owner | Travis Britt E | $123,057 |
Source: Public Records
Tax History Compared to Growth
Tax History
| Year | Tax Paid | Tax Assessment Tax Assessment Total Assessment is a certain percentage of the fair market value that is determined by local assessors to be the total taxable value of land and additions on the property. | Land | Improvement |
|---|---|---|---|---|
| 2025 | $6,049 | $481,600 | $165,200 | $316,400 |
| 2024 | $5,799 | $450,900 | $150,800 | $300,100 |
| 2023 | $5,588 | $428,200 | $143,700 | $284,500 |
| 2022 | $5,512 | $391,500 | $119,800 | $271,700 |
| 2021 | $5,316 | $368,900 | $119,800 | $249,100 |
| 2020 | $5,062 | $356,000 | $119,800 | $236,200 |
| 2019 | $4,959 | $349,000 | $119,800 | $229,200 |
| 2018 | $4,617 | $320,400 | $115,200 | $205,200 |
| 2017 | $4,490 | $313,100 | $115,200 | $197,900 |
| 2016 | $4,240 | $296,700 | $113,200 | $183,500 |
| 2015 | $4,064 | $285,200 | $108,900 | $176,300 |
| 2014 | $4,075 | $278,000 | $106,400 | $171,600 |
Source: Public Records
Map
Nearby Homes