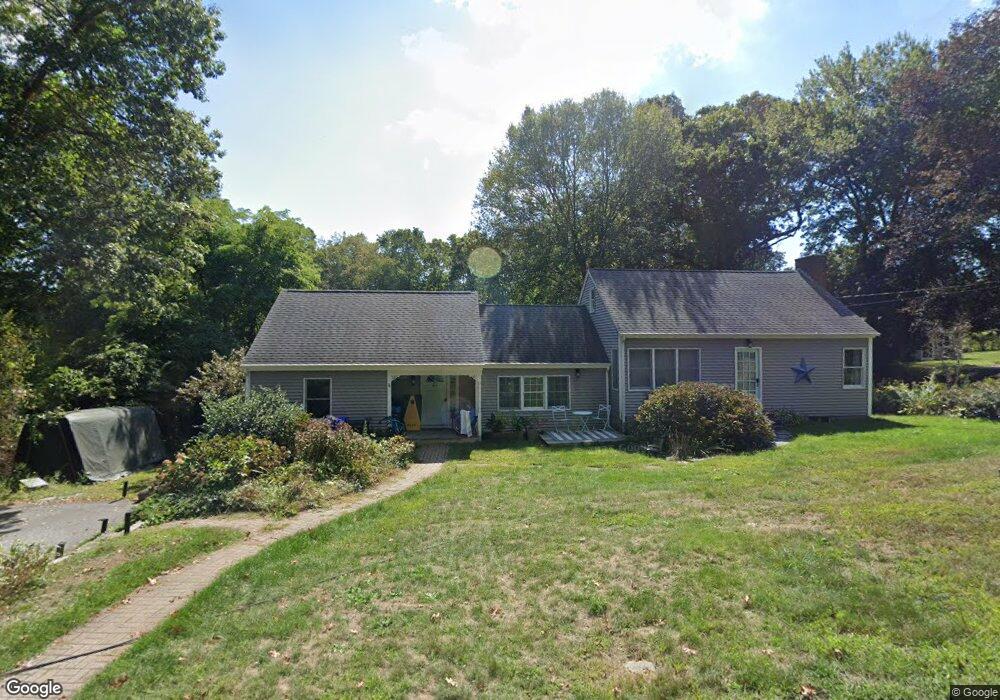
21 Boulder Ct Mystic, CT 06355
Old Mystic NeighborhoodEstimated Value: $485,000 - $509,000
4
Beds
2
Baths
1,716
Sq Ft
$287/Sq Ft
Est. Value
About This Home
This home is located at 21 Boulder Ct, Mystic, CT 06355 and is currently estimated at $491,937, approximately $286 per square foot. 21 Boulder Ct is a home located in New London County with nearby schools including Northeast Academy Arts Magnet School, Groton Middle School, and Robert E. Fitch High School.
Ownership History
Date
Name
Owned For
Owner Type
Purchase Details
Closed on
Apr 6, 2009
Sold by
Graboski Edward J and Graboski Cheryl B
Bought by
Richardson Matthew A and Richardson Faith C W
Current Estimated Value
Home Financials for this Owner
Home Financials are based on the most recent Mortgage that was taken out on this home.
Original Mortgage
$230,000
Outstanding Balance
$111,194
Interest Rate
4.92%
Mortgage Type
Purchase Money Mortgage
Estimated Equity
$380,743
Create a Home Valuation Report for This Property
The Home Valuation Report is an in-depth analysis detailing your home's value as well as a comparison with similar homes in the area
Home Values in the Area
Average Home Value in this Area
Purchase History
| Date | Buyer | Sale Price | Title Company |
|---|---|---|---|
| Richardson Matthew A | $260,000 | -- |
Source: Public Records
Mortgage History
| Date | Status | Borrower | Loan Amount |
|---|---|---|---|
| Open | Richardson Matthew A | $230,000 | |
| Previous Owner | Richardson Matthew A | $100,000 |
Source: Public Records
Tax History Compared to Growth
Tax History
| Year | Tax Paid | Tax Assessment Tax Assessment Total Assessment is a certain percentage of the fair market value that is determined by local assessors to be the total taxable value of land and additions on the property. | Land | Improvement |
|---|---|---|---|---|
| 2025 | $5,515 | $201,950 | $105,028 | $96,922 |
| 2024 | $5,166 | $201,950 | $105,028 | $96,922 |
| 2023 | $4,954 | $201,950 | $63,490 | $138,460 |
| 2022 | $4,917 | $201,950 | $63,490 | $138,460 |
| 2021 | $4,957 | $171,640 | $78,400 | $93,240 |
| 2020 | $4,904 | $171,640 | $78,400 | $93,240 |
| 2019 | $4,694 | $171,640 | $78,400 | $93,240 |
| 2018 | $4,572 | $168,910 | $78,400 | $90,510 |
| 2017 | $4,490 | $168,910 | $78,400 | $90,510 |
| 2016 | $4,530 | $183,540 | $95,760 | $87,780 |
| 2015 | $4,377 | $183,540 | $95,760 | $87,780 |
| 2014 | $4,254 | $183,540 | $95,760 | $87,780 |
Source: Public Records
Map
Nearby Homes
- 1198 River Rd
- 27 Bolles Ln
- 86 Fair Acres Cir
- 79 Fair Acres Cir
- 40 Riverbend Dr
- 10 Pleasant St
- 435 High St Unit 31
- 435 High St Unit 4
- 435 High St Unit 30
- 435 High St Unit 58
- 435 High St Unit 26
- 115 Lamphere Rd
- 375 Allyn St Unit 2
- 23 Fenwick Ct
- 85 Ann Ave
- 147 Pequot Ave
- 5 Park Place
- 28 Rossie St
- 50 Benjamin Stanton Pentway
- 38 Rossie St
- 37 Boulder Ct
- 7 Boulder Ct
- 6 Boulder Ct
- 18 Boulder Ct
- 47 Boulder Ct
- 32 Boulder Ct
- 105 Oral School Rd
- 135 Oral School Rd
- 46 Boulder Ct
- 70 Oral School Rd
- 140 Oral School Rd
- 101 Oral School Rd
- 54 Boulder Ct
- 67 Hancock Dr
- 65 Hancock Dr
- 155 Oral School Rd
- 64 Hancock Dr
- 15 Oral School Rd
- 195 Oral School Rd