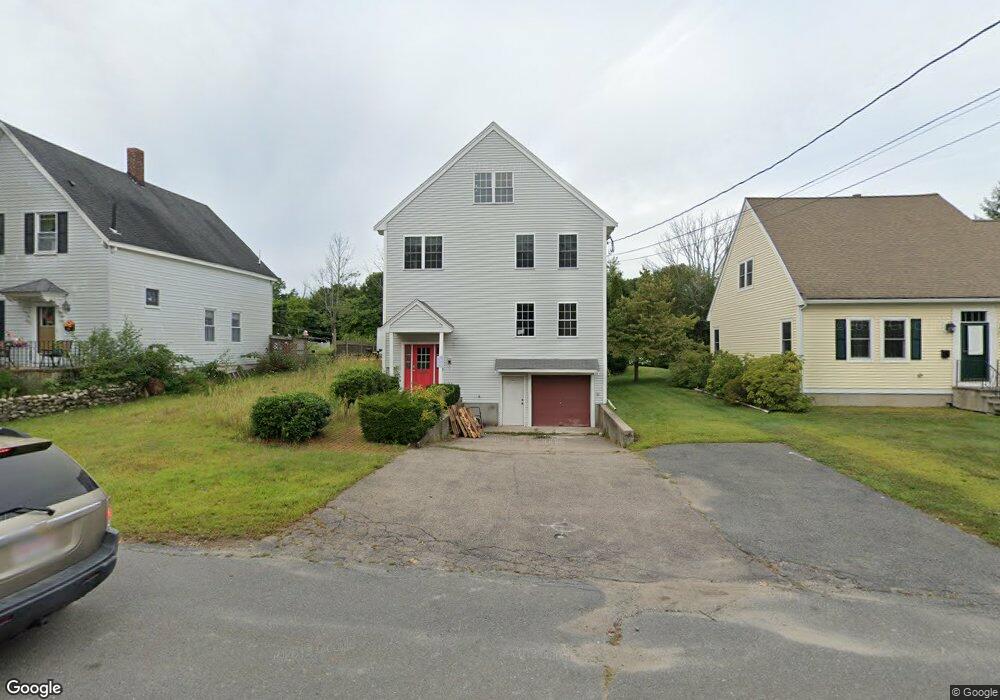
21 Broad St Medway, MA 02053
Estimated Value: $488,561
--
Bed
1
Bath
5,760
Sq Ft
$85/Sq Ft
Est. Value
About This Home
This home is located at 21 Broad St, Medway, MA 02053 and is currently estimated at $488,561, approximately $84 per square foot. 21 Broad St is a home located in Norfolk County with nearby schools including John D. McGovern Elementary School, Burke-Memorial Elementary, and Medway Middle School.
Ownership History
Date
Name
Owned For
Owner Type
Purchase Details
Closed on
Oct 28, 2021
Sold by
21 Broad St Medway Llc
Bought by
21 Medway Re Llc
Current Estimated Value
Home Financials for this Owner
Home Financials are based on the most recent Mortgage that was taken out on this home.
Original Mortgage
$200,000
Outstanding Balance
$181,985
Interest Rate
2.8%
Mortgage Type
Purchase Money Mortgage
Estimated Equity
$306,576
Purchase Details
Closed on
Jun 2, 2016
Sold by
Pilkington Donald A and Pilkington Susan M
Bought by
21 Broad Street Llc
Purchase Details
Closed on
Sep 24, 1985
Bought by
Pilkington Donald and Pilkington Susan
Create a Home Valuation Report for This Property
The Home Valuation Report is an in-depth analysis detailing your home's value as well as a comparison with similar homes in the area
Home Values in the Area
Average Home Value in this Area
Purchase History
| Date | Buyer | Sale Price | Title Company |
|---|---|---|---|
| 21 Medway Re Llc | $400,000 | None Available | |
| 21 Medway Re Llc | $400,000 | None Available | |
| 21 Broad Street Llc | $300,000 | -- | |
| 21 Broad Street Llc | $300,000 | -- | |
| Pilkington Donald | $65,000 | -- |
Source: Public Records
Mortgage History
| Date | Status | Borrower | Loan Amount |
|---|---|---|---|
| Open | 21 Medway Re Llc | $200,000 | |
| Closed | 21 Medway Re Llc | $200,000 |
Source: Public Records
Tax History Compared to Growth
Tax History
| Year | Tax Paid | Tax Assessment Tax Assessment Total Assessment is a certain percentage of the fair market value that is determined by local assessors to be the total taxable value of land and additions on the property. | Land | Improvement |
|---|---|---|---|---|
| 2025 | $5,334 | $374,300 | $135,800 | $238,500 |
| 2024 | $5,390 | $374,300 | $135,800 | $238,500 |
| 2023 | $5,966 | $374,300 | $135,800 | $238,500 |
| 2022 | $5,734 | $338,700 | $121,500 | $217,200 |
| 2021 | $5,395 | $309,000 | $108,000 | $201,000 |
| 2020 | $5,408 | $309,000 | $108,000 | $201,000 |
| 2019 | $5,244 | $309,000 | $108,000 | $201,000 |
| 2018 | $4,936 | $279,500 | $108,000 | $171,500 |
| 2017 | $4,564 | $254,700 | $91,800 | $162,900 |
| 2016 | $5,040 | $278,300 | $91,800 | $186,500 |
| 2015 | $5,056 | $277,200 | $91,800 | $185,400 |
| 2014 | $5,283 | $280,400 | $91,800 | $188,600 |
Source: Public Records
Map
Nearby Homes
- 20 Broad St Unit 6
- 20 Broad St Unit A
- 20 Broad St Unit 4
- 9 Sanford St
- 14 Sanford St Unit 15
- 841 Lincoln St
- 56 Fuller Place
- 50 Main St
- 7 Gloucester Dr
- 2 Skyline Dr
- 16 Lexington Ln
- 280 Village St Unit D2
- 0 Elm St
- 3 Meryl St
- 4 Shaw St
- 22 Sunset Dr
- 732 Lincoln St
- 24 Shayne Rd Unit 219
- 106 Holliston St
- 12 Lovering St