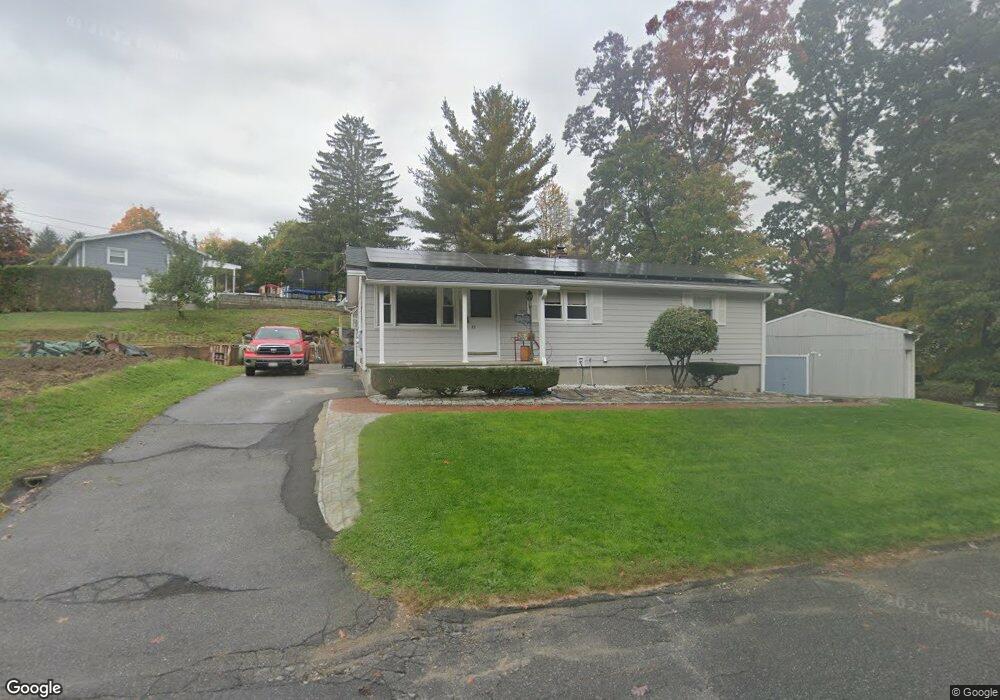
21 Bruce St Leominster, MA 01453
Estimated Value: $388,000 - $483,000
3
Beds
2
Baths
1,485
Sq Ft
$305/Sq Ft
Est. Value
About This Home
This home is located at 21 Bruce St, Leominster, MA 01453 and is currently estimated at $452,966, approximately $305 per square foot. 21 Bruce St is a home located in Worcester County with nearby schools including Leominster High School, St. Leo School, and St. Anna Catholic School.
Ownership History
Date
Name
Owned For
Owner Type
Purchase Details
Closed on
Aug 31, 2001
Sold by
Dellechiaie Ronald J and Dellechiaie Carol M
Bought by
Dellechiaie Dino
Current Estimated Value
Home Financials for this Owner
Home Financials are based on the most recent Mortgage that was taken out on this home.
Original Mortgage
$70,000
Outstanding Balance
$27,435
Interest Rate
7.06%
Mortgage Type
Purchase Money Mortgage
Estimated Equity
$425,531
Create a Home Valuation Report for This Property
The Home Valuation Report is an in-depth analysis detailing your home's value as well as a comparison with similar homes in the area
Home Values in the Area
Average Home Value in this Area
Purchase History
| Date | Buyer | Sale Price | Title Company |
|---|---|---|---|
| Dellechiaie Dino | $125,000 | -- |
Source: Public Records
Mortgage History
| Date | Status | Borrower | Loan Amount |
|---|---|---|---|
| Open | Dellechiaie Dino | $70,000 | |
| Previous Owner | Dellechiaie Dino | $50,000 |
Source: Public Records
Tax History Compared to Growth
Tax History
| Year | Tax Paid | Tax Assessment Tax Assessment Total Assessment is a certain percentage of the fair market value that is determined by local assessors to be the total taxable value of land and additions on the property. | Land | Improvement |
|---|---|---|---|---|
| 2025 | $5,678 | $404,700 | $127,100 | $277,600 |
| 2024 | $5,331 | $367,400 | $121,000 | $246,400 |
| 2023 | $5,173 | $332,900 | $105,200 | $227,700 |
| 2022 | $4,975 | $300,400 | $91,500 | $208,900 |
| 2021 | $4,763 | $262,700 | $71,200 | $191,500 |
| 2020 | $4,569 | $254,100 | $71,200 | $182,900 |
| 2019 | $4,374 | $235,900 | $67,800 | $168,100 |
| 2018 | $4,266 | $220,700 | $65,800 | $154,900 |
| 2017 | $4,011 | $203,300 | $61,500 | $141,800 |
| 2016 | $3,851 | $196,700 | $61,500 | $135,200 |
| 2015 | $3,664 | $188,500 | $61,500 | $127,000 |
| 2014 | $3,370 | $178,400 | $65,000 | $113,400 |
Source: Public Records
Map
Nearby Homes
- 91 Eugene St
- 594 Pleasant St
- 98 Sylvan Ave
- 104 Sylvan Ave
- 399 Union St
- 41 Hill St
- 44 Old Brook Rd
- 302 Pleasant St
- 45 Tisdale St
- 48 Chestnut St
- 192 Pleasant St Unit 23
- 871 Pleasant St
- 181 Pond St
- 93 Chapman Place Unit 93
- 177 Chapman Place
- 12 Walden Ct
- 556 Central St Unit 43
- 556 Central St Unit 39
- 25 Union St
- 197 Chapman Place Unit 197