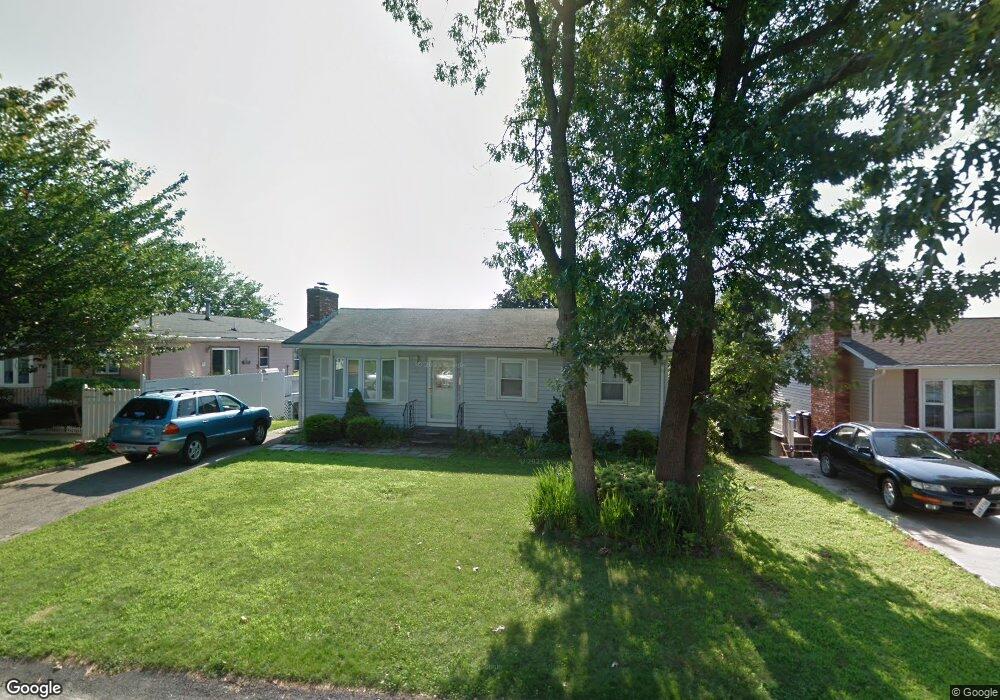
21 Burr St Cranston, RI 02920
Budlong NeighborhoodEstimated Value: $407,724 - $450,000
3
Beds
1
Bath
980
Sq Ft
$444/Sq Ft
Est. Value
About This Home
This home is located at 21 Burr St, Cranston, RI 02920 and is currently estimated at $435,431, approximately $444 per square foot. 21 Burr St is a home located in Providence County with nearby schools including Woodridge Elementary School, Western Hills Middle School, and Cranston High School West.
Ownership History
Date
Name
Owned For
Owner Type
Purchase Details
Closed on
Sep 15, 1998
Sold by
Nichols Linda A
Bought by
Pescarino Cheryl A
Current Estimated Value
Home Financials for this Owner
Home Financials are based on the most recent Mortgage that was taken out on this home.
Original Mortgage
$85,500
Outstanding Balance
$17,376
Interest Rate
6.92%
Estimated Equity
$418,055
Create a Home Valuation Report for This Property
The Home Valuation Report is an in-depth analysis detailing your home's value as well as a comparison with similar homes in the area
Home Values in the Area
Average Home Value in this Area
Purchase History
We collect this data history from publicly available records. To have your information removed, we recommend requesting removal directly through your county’s website.
| Date | Buyer | Sale Price | Title Company |
|---|---|---|---|
| Pescarino Cheryl A | $95,000 | -- |
Source: Public Records
Mortgage History
We collect this data history from publicly available records. To have your information removed, we recommend requesting removal directly through your county’s website.
| Date | Status | Borrower | Loan Amount |
|---|---|---|---|
| Open | Pescarino Cheryl A | $85,500 |
Source: Public Records
Tax History
| Year | Tax Paid | Tax Assessment Tax Assessment Total Assessment is a certain percentage of the fair market value that is determined by local assessors to be the total taxable value of land and additions on the property. | Land | Improvement |
|---|---|---|---|---|
| 2025 | $4,501 | $324,300 | $108,800 | $215,500 |
| 2024 | $4,414 | $324,300 | $108,800 | $215,500 |
| 2023 | $4,566 | $241,600 | $71,700 | $169,900 |
| 2022 | $4,472 | $241,600 | $71,700 | $169,900 |
| 2021 | $4,349 | $241,600 | $71,700 | $169,900 |
| 2020 | $4,115 | $198,100 | $68,200 | $129,900 |
| 2019 | $4,115 | $198,100 | $68,200 | $129,900 |
| 2018 | $4,019 | $198,100 | $68,200 | $129,900 |
| 2017 | $3,948 | $172,100 | $61,400 | $110,700 |
| 2016 | $3,864 | $172,100 | $61,400 | $110,700 |
| 2015 | $3,864 | $172,100 | $61,400 | $110,700 |
| 2014 | $3,716 | $162,700 | $61,400 | $101,300 |
Source: Public Records
Map
Nearby Homes
- 75 Macbeth St
- 28 Ashley St
- 115 Hazelton St
- 84 N View Ave
- 25 Plaza St
- 150 Salem Ave
- 100 E View Ave
- 64 Amherst Rd
- 446 Budlong Rd
- 1428 Park Ave
- 1455 Park Ave Unit 1
- 1455 Park Ave Unit 3
- 1455 Park Ave Unit 4
- 1455 Park Ave Unit 5
- 1455 Park Ave Unit 2
- 120 Bretton Woods Dr
- 80 Phenix Ave
- 21 Brookwood Rd
- 141 Glen Ridge Rd
- 47 Knollwood Ave
Your Personal Tour Guide
Ask me questions while you tour the home.