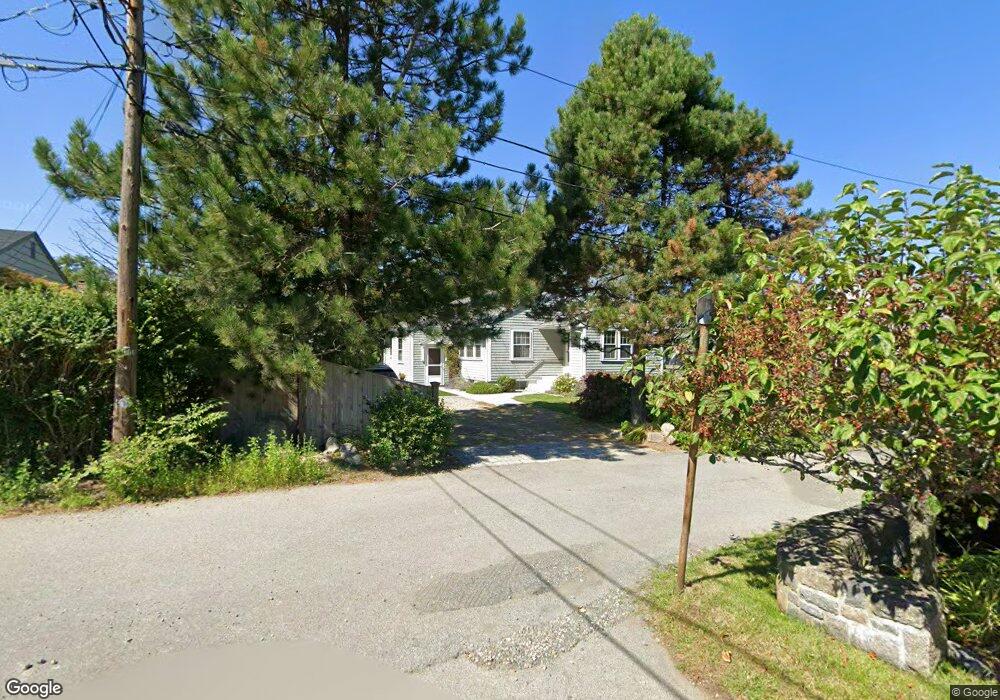
21 Calebs Ln Rockport, MA 01966
Estimated Value: $939,773 - $1,294,000
2
Beds
1
Bath
1,239
Sq Ft
$849/Sq Ft
Est. Value
About This Home
This home is located at 21 Calebs Ln, Rockport, MA 01966 and is currently estimated at $1,051,943, approximately $849 per square foot. 21 Calebs Ln is a home located in Essex County with nearby schools including Rockport Elementary School, Rockport Middle School, and Rockport High School.
Ownership History
Date
Name
Owned For
Owner Type
Purchase Details
Closed on
Jul 19, 2002
Sold by
Burge Harriet A
Bought by
Barcus Mary M
Current Estimated Value
Purchase Details
Closed on
Nov 18, 1997
Sold by
Bosley Edward S Est and Steffensen
Bought by
Burge Walter G and Burge Harriet A
Create a Home Valuation Report for This Property
The Home Valuation Report is an in-depth analysis detailing your home's value as well as a comparison with similar homes in the area
Home Values in the Area
Average Home Value in this Area
Purchase History
| Date | Buyer | Sale Price | Title Company |
|---|---|---|---|
| Barcus Mary M | $495,000 | -- | |
| Barcus Mary M | $495,000 | -- | |
| Burge Walter G | $259,000 | -- | |
| Burge Walter G | $259,000 | -- |
Source: Public Records
Mortgage History
| Date | Status | Borrower | Loan Amount |
|---|---|---|---|
| Open | Burge Walter G | $342,000 | |
| Closed | Burge Walter G | $250,000 | |
| Closed | Burge Walter G | $46,600 |
Source: Public Records
Tax History Compared to Growth
Tax History
| Year | Tax Paid | Tax Assessment Tax Assessment Total Assessment is a certain percentage of the fair market value that is determined by local assessors to be the total taxable value of land and additions on the property. | Land | Improvement |
|---|---|---|---|---|
| 2025 | $6,997 | $798,700 | $416,800 | $381,900 |
| 2024 | $6,725 | $798,700 | $416,800 | $381,900 |
| 2023 | $6,186 | $656,000 | $343,100 | $312,900 |
| 2022 | $5,985 | $609,500 | $348,300 | $261,200 |
| 2021 | $5,681 | $583,300 | $331,600 | $251,700 |
| 2020 | $5,865 | $580,700 | $373,200 | $207,500 |
| 2019 | $5,519 | $559,700 | $363,700 | $196,000 |
| 2018 | $5,240 | $518,300 | $337,700 | $180,600 |
| 2017 | $5,101 | $452,200 | $306,200 | $146,000 |
| 2016 | $4,991 | $443,600 | $297,600 | $146,000 |
| 2015 | $4,865 | $442,300 | $297,600 | $144,700 |
| 2014 | $4,641 | $411,800 | $274,700 | $137,100 |
Source: Public Records
Map
Nearby Homes
- 5 Allen Ave
- 57 Mt Pleasant St Unit 2B
- 4 Norwood Ave
- 34 Mount Pleasant St
- 6 Prospect St
- 12 Seagull St
- 13 Pleasant St Unit 3
- 2 Mount Pleasant St Unit 3
- 29 Summer St
- 15 High St Unit D
- 4 Alpaca Ct
- 5 Marshall Ln
- 1 Arens Rd
- 36 Broadway Ave
- 63R Main St Unit 2
- 73-77 Main St
- 123 Main St Unit 2
- 135 A&B Main St
- 13 Rowe Point
- 1 Doctors Run