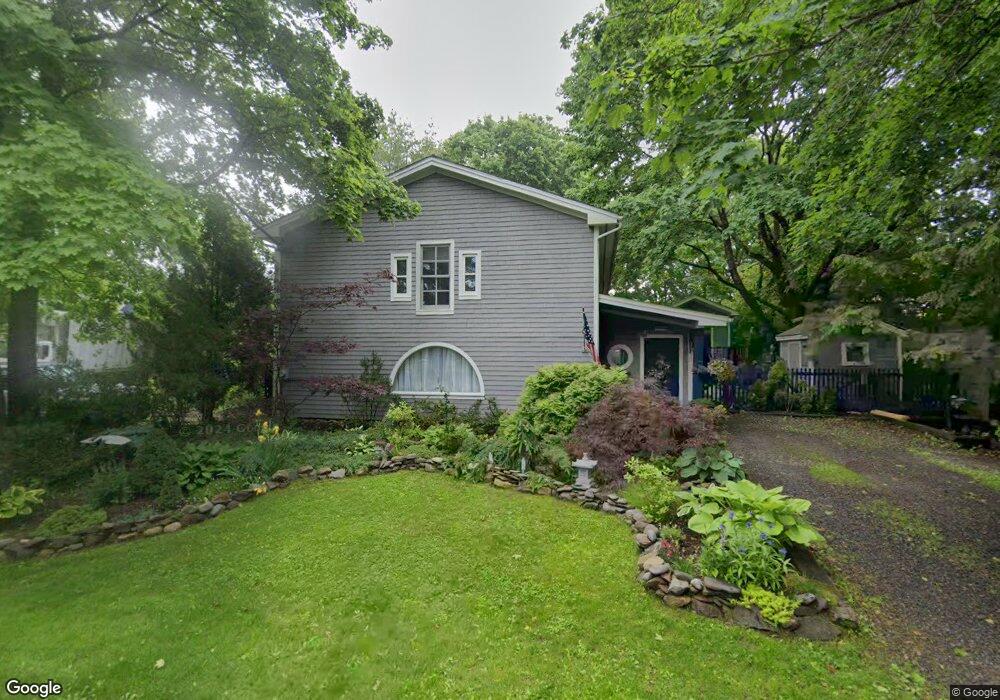
21 Camden St Rockport, ME 04856
Estimated Value: $686,142 - $812,000
3
Beds
2
Baths
2,706
Sq Ft
$274/Sq Ft
Est. Value
About This Home
This home is located at 21 Camden St, Rockport, ME 04856 and is currently estimated at $742,036, approximately $274 per square foot. 21 Camden St is a home located in Knox County with nearby schools including Camden-Rockport Elementary School, Camden-Rockport Middle School, and Camden Hills Regional High School.
Ownership History
Date
Name
Owned For
Owner Type
Purchase Details
Closed on
Dec 1, 2005
Sold by
Oxton Wayne D
Bought by
Farrell-Oxton Michele
Current Estimated Value
Create a Home Valuation Report for This Property
The Home Valuation Report is an in-depth analysis detailing your home's value as well as a comparison with similar homes in the area
Home Values in the Area
Average Home Value in this Area
Purchase History
| Date | Buyer | Sale Price | Title Company |
|---|---|---|---|
| Farrell-Oxton Michele | -- | -- |
Source: Public Records
Tax History Compared to Growth
Tax History
| Year | Tax Paid | Tax Assessment Tax Assessment Total Assessment is a certain percentage of the fair market value that is determined by local assessors to be the total taxable value of land and additions on the property. | Land | Improvement |
|---|---|---|---|---|
| 2024 | $7,617 | $534,500 | $98,000 | $436,500 |
| 2023 | $6,761 | $534,500 | $98,000 | $436,500 |
| 2022 | $5,265 | $340,800 | $61,300 | $279,500 |
| 2021 | $4,542 | $266,400 | $70,600 | $195,800 |
| 2020 | $4,478 | $266,400 | $70,600 | $195,800 |
| 2019 | $4,542 | $266,400 | $70,600 | $195,800 |
| 2018 | $4,284 | $266,400 | $70,600 | $195,800 |
| 2017 | $3,929 | $266,400 | $70,600 | $195,800 |
| 2016 | $3,892 | $266,400 | $70,600 | $195,800 |
| 2015 | $3,930 | $279,700 | $83,900 | $195,800 |
| 2014 | $3,761 | $289,500 | $68,500 | $221,000 |
| 2013 | $3,674 | $289,500 | $68,500 | $221,000 |
Source: Public Records
Map
Nearby Homes
- 10 Summer St Unit 7
- 10 Summer St Unit 1
- 00 Roc Crest Dr
- 21 Main St
- 1 Ship St
- 11 Spruce St
- 19 Lily Pond Dr
- 198 Beauchamp Point Rd
- 116 Mistic Ave
- 109 Mistic Ave
- 21 Conway Rd
- 180 Mistic Ave
- 54 Beech Hill Rd
- 34 Curtis Ave
- 93 Elm St
- Lot #19 Greenfield Dr
- Lot #23 Greenfield Dr
- 84 Elm St
- 76 Park St
- 33 Pearl St