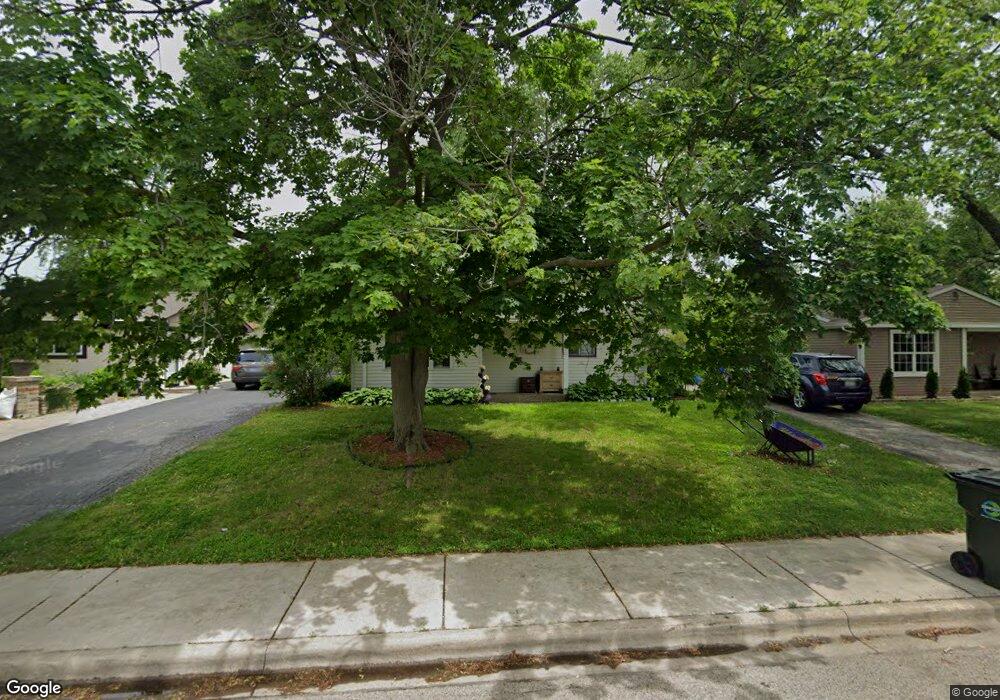
21 Cardinal Ln Carpentersville, IL 60110
Estimated Value: $218,000 - $240,000
3
Beds
--
Bath
920
Sq Ft
$249/Sq Ft
Est. Value
About This Home
This home is located at 21 Cardinal Ln, Carpentersville, IL 60110 and is currently estimated at $229,153, approximately $249 per square foot. 21 Cardinal Ln is a home located in Kane County with nearby schools including Meadowdale Elementary School, Crescent City Grade School, and Carpentersville Middle School.
Ownership History
Date
Name
Owned For
Owner Type
Purchase Details
Closed on
Feb 28, 2024
Sold by
Kane County Teachers Cu
Bought by
Rosengarten John
Current Estimated Value
Purchase Details
Closed on
Oct 14, 2005
Sold by
Rosengarten John L
Bought by
Rosengarten John L and Lee Pamela M
Home Financials for this Owner
Home Financials are based on the most recent Mortgage that was taken out on this home.
Original Mortgage
$150,300
Interest Rate
5.89%
Mortgage Type
New Conventional
Purchase Details
Closed on
Feb 9, 1998
Sold by
Apichairuk Somsak
Bought by
Rosengarten John L
Home Financials for this Owner
Home Financials are based on the most recent Mortgage that was taken out on this home.
Original Mortgage
$81,800
Interest Rate
7.12%
Mortgage Type
FHA
Create a Home Valuation Report for This Property
The Home Valuation Report is an in-depth analysis detailing your home's value as well as a comparison with similar homes in the area
Home Values in the Area
Average Home Value in this Area
Purchase History
| Date | Buyer | Sale Price | Title Company |
|---|---|---|---|
| Rosengarten John | $170,000 | None Listed On Document | |
| Rosengarten John L | -- | Lawyers | |
| Rosengarten John L | $79,500 | Inter County Title Co |
Source: Public Records
Mortgage History
| Date | Status | Borrower | Loan Amount |
|---|---|---|---|
| Previous Owner | Rosengarten John L | $150,300 | |
| Previous Owner | Rosengarten John L | $81,800 |
Source: Public Records
Tax History Compared to Growth
Tax History
| Year | Tax Paid | Tax Assessment Tax Assessment Total Assessment is a certain percentage of the fair market value that is determined by local assessors to be the total taxable value of land and additions on the property. | Land | Improvement |
|---|---|---|---|---|
| 2024 | $3,765 | $65,709 | $12,553 | $53,156 |
| 2023 | $3,623 | $59,123 | $11,295 | $47,828 |
| 2022 | $3,540 | $51,651 | $11,295 | $40,356 |
| 2021 | $3,421 | $48,769 | $10,665 | $38,104 |
| 2020 | $3,350 | $47,672 | $10,425 | $37,247 |
| 2019 | $3,241 | $45,256 | $9,897 | $35,359 |
| 2018 | $2,613 | $39,334 | $9,701 | $29,633 |
| 2017 | $2,441 | $36,795 | $9,075 | $27,720 |
| 2016 | $2,063 | $31,748 | $8,787 | $22,961 |
| 2015 | -- | $24,925 | $8,234 | $16,691 |
| 2014 | -- | $22,498 | $8,007 | $14,491 |
| 2013 | -- | $23,187 | $8,252 | $14,935 |
Source: Public Records
Map
Nearby Homes