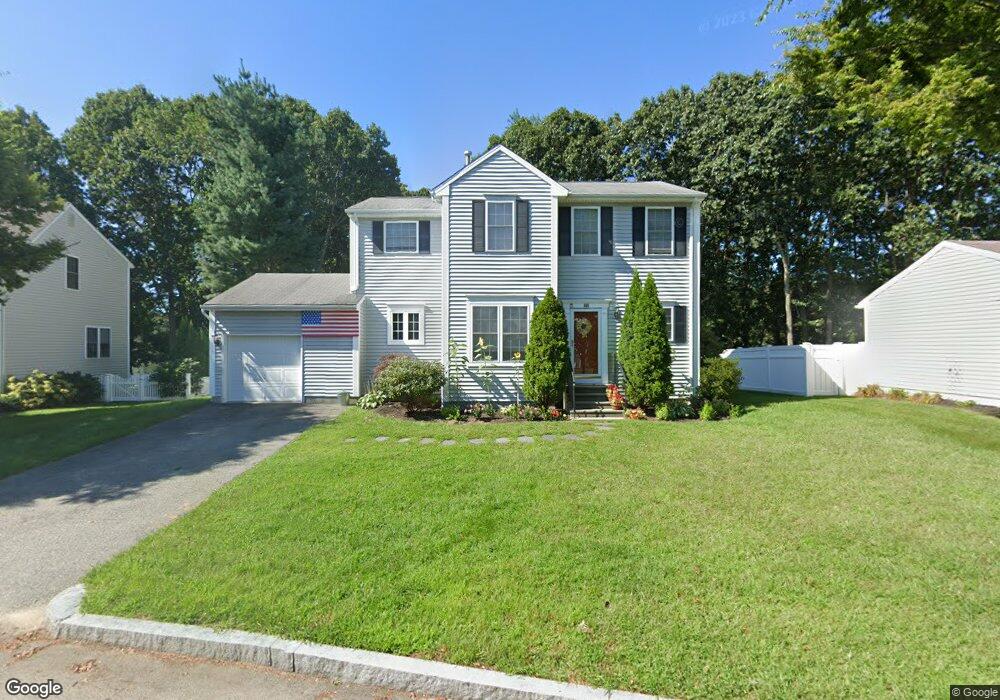
21 Carousel Dr Riverside, RI 02915
Riverside NeighborhoodEstimated Value: $640,000 - $798,000
3
Beds
3
Baths
1,620
Sq Ft
$453/Sq Ft
Est. Value
About This Home
This home is located at 21 Carousel Dr, Riverside, RI 02915 and is currently estimated at $734,079, approximately $453 per square foot. 21 Carousel Dr is a home located in Providence County with nearby schools including East Providence High School, St Luke Elementary School, and St Mary Academy-Bay View.
Ownership History
Date
Name
Owned For
Owner Type
Purchase Details
Closed on
Sep 12, 2023
Sold by
Drysdale Robert P
Bought by
Drysdale Robert P and Drysdale Karlene D
Current Estimated Value
Purchase Details
Closed on
Dec 15, 2000
Sold by
Jgp Builders
Bought by
Lass James T and Lass Tracey
Home Financials for this Owner
Home Financials are based on the most recent Mortgage that was taken out on this home.
Original Mortgage
$226,730
Interest Rate
7.7%
Mortgage Type
Purchase Money Mortgage
Create a Home Valuation Report for This Property
The Home Valuation Report is an in-depth analysis detailing your home's value as well as a comparison with similar homes in the area
Home Values in the Area
Average Home Value in this Area
Purchase History
| Date | Buyer | Sale Price | Title Company |
|---|---|---|---|
| Drysdale Robert P | -- | None Available | |
| Drysdale Robert P | -- | None Available | |
| Lass James T | $23,900 | -- | |
| Lass James T | $23,900 | -- |
Source: Public Records
Mortgage History
| Date | Status | Borrower | Loan Amount |
|---|---|---|---|
| Previous Owner | Lass James T | $50,000 | |
| Previous Owner | Lass James T | $255,000 | |
| Previous Owner | Lass James T | $253,500 | |
| Previous Owner | Lass James T | $226,730 |
Source: Public Records
Tax History
| Year | Tax Paid | Tax Assessment Tax Assessment Total Assessment is a certain percentage of the fair market value that is determined by local assessors to be the total taxable value of land and additions on the property. | Land | Improvement |
|---|---|---|---|---|
| 2025 | $9,476 | $725,000 | $327,400 | $397,600 |
| 2024 | $9,002 | $587,200 | $272,900 | $314,300 |
| 2023 | $8,667 | $587,200 | $272,900 | $314,300 |
| 2022 | $9,645 | $441,200 | $183,600 | $257,600 |
| 2021 | $9,486 | $441,200 | $183,600 | $257,600 |
| 2020 | $8,462 | $411,000 | $183,600 | $227,400 |
| 2019 | $8,220 | $410,600 | $183,600 | $227,000 |
| 2018 | $8,001 | $349,700 | $159,200 | $190,500 |
| 2017 | $7,823 | $349,700 | $159,200 | $190,500 |
| 2016 | $7,784 | $349,700 | $159,200 | $190,500 |
| 2015 | $7,583 | $330,400 | $116,200 | $214,200 |
| 2014 | $7,583 | $330,400 | $116,200 | $214,200 |
Source: Public Records
Map
Nearby Homes
Your Personal Tour Guide
Ask me questions while you tour the home.