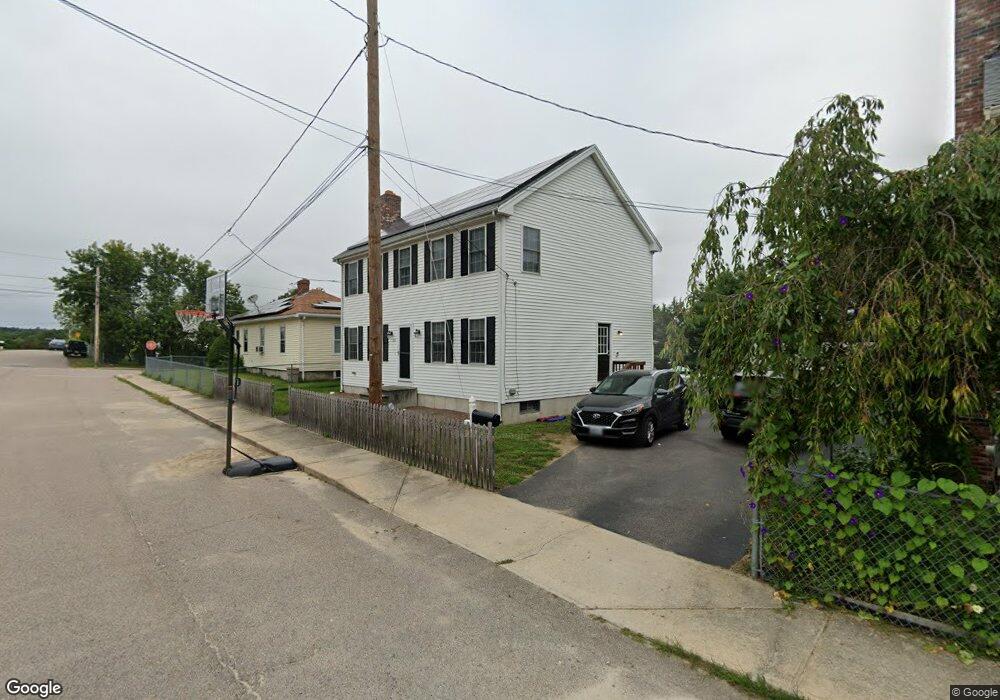
21 Carrington St Blackstone, MA 01504
Estimated Value: $496,175 - $564,000
3
Beds
3
Baths
1,768
Sq Ft
$301/Sq Ft
Est. Value
About This Home
This home is located at 21 Carrington St, Blackstone, MA 01504 and is currently estimated at $531,294, approximately $300 per square foot. 21 Carrington St is a home located in Worcester County with nearby schools including Blackstone-Millville Regional High School, Founders Academy, and Beacon Charter School.
Ownership History
Date
Name
Owned For
Owner Type
Purchase Details
Closed on
May 22, 2020
Sold by
Cusack Jessica L and Sargo Jessica
Bought by
Sargo Jessica and Sargo Matthew
Current Estimated Value
Home Financials for this Owner
Home Financials are based on the most recent Mortgage that was taken out on this home.
Original Mortgage
$241,000
Outstanding Balance
$212,622
Interest Rate
3.3%
Mortgage Type
New Conventional
Estimated Equity
$318,672
Purchase Details
Closed on
May 27, 2011
Sold by
Cousineau Kevin F and Cousineau Jessica L
Bought by
Cusack Jessica L
Purchase Details
Closed on
Aug 10, 2006
Sold by
Country Home Builders
Bought by
Cousineau Jessica L and Cousineau Kevin F
Home Financials for this Owner
Home Financials are based on the most recent Mortgage that was taken out on this home.
Original Mortgage
$263,920
Interest Rate
6.8%
Mortgage Type
Purchase Money Mortgage
Create a Home Valuation Report for This Property
The Home Valuation Report is an in-depth analysis detailing your home's value as well as a comparison with similar homes in the area
Home Values in the Area
Average Home Value in this Area
Purchase History
| Date | Buyer | Sale Price | Title Company |
|---|---|---|---|
| Sargo Jessica | -- | None Available | |
| Cusack Jessica L | -- | -- | |
| Cusack Jessica L | -- | -- | |
| Cousineau Jessica L | $329,900 | -- | |
| Cousineau Jessica L | $329,900 | -- |
Source: Public Records
Mortgage History
| Date | Status | Borrower | Loan Amount |
|---|---|---|---|
| Open | Sargo Jessica | $241,000 | |
| Previous Owner | Cousineau Jessica L | $263,920 |
Source: Public Records
Tax History Compared to Growth
Tax History
| Year | Tax Paid | Tax Assessment Tax Assessment Total Assessment is a certain percentage of the fair market value that is determined by local assessors to be the total taxable value of land and additions on the property. | Land | Improvement |
|---|---|---|---|---|
| 2025 | $5,963 | $394,900 | $99,000 | $295,900 |
| 2024 | $5,578 | $341,600 | $99,000 | $242,600 |
| 2023 | $5,100 | $315,200 | $99,000 | $216,200 |
| 2022 | $5,302 | $296,200 | $94,700 | $201,500 |
| 2021 | $5,101 | $272,500 | $86,100 | $186,400 |
| 2020 | $5,045 | $267,500 | $86,100 | $181,400 |
| 2019 | $4,928 | $260,600 | $79,200 | $181,400 |
| 2018 | $4,832 | $247,900 | $75,400 | $172,500 |
| 2017 | $4,536 | $235,500 | $75,400 | $160,100 |
| 2016 | $4,514 | $233,400 | $67,200 | $166,200 |
| 2015 | $4,362 | $223,900 | $67,200 | $156,700 |
Source: Public Records
Map
Nearby Homes
- 259 Main St
- 1 Tupperware Dr Unit 226
- 1 Tupperware Dr Unit 138
- 1 Tupperware Dr Unit 108
- 0 Main St
- 225-227 Main St
- 6 Old Mendon St
- 8 Old Mendon St Unit 8
- 122 Canal St
- 175 Saint Paul St
- 22 Colerick Ave
- 81 Fountain St
- 12 Keough St
- 470 Saint Paul St
- 96 Main St Unit 1
- 29 Graves Ave
- 24 Reilly Ave
- 4 Sharon Pkwy
- 15 Blackstone St
- 5 Lincoln Dr