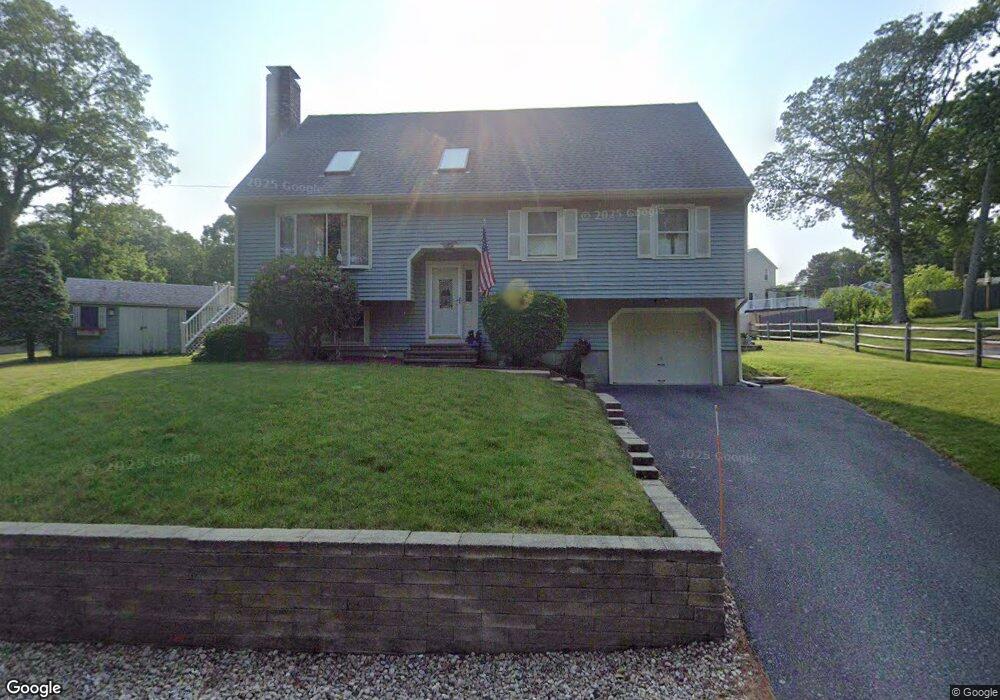
21 Carver Rd Bourne, MA 02562
Estimated Value: $778,000 - $887,000
3
Beds
3
Baths
1,801
Sq Ft
$473/Sq Ft
Est. Value
About This Home
This home is located at 21 Carver Rd, Bourne, MA 02562 and is currently estimated at $850,990, approximately $472 per square foot. 21 Carver Rd is a home located in Barnstable County with nearby schools including Bourne High School, Bridgeview Montessori School, and New Testament Christian School.
Ownership History
Date
Name
Owned For
Owner Type
Purchase Details
Closed on
Sep 30, 2009
Sold by
Cottone Francesca
Bought by
Bassford Kathy L and Krawczyk Peter H
Current Estimated Value
Home Financials for this Owner
Home Financials are based on the most recent Mortgage that was taken out on this home.
Original Mortgage
$281,600
Interest Rate
5.12%
Mortgage Type
Purchase Money Mortgage
Purchase Details
Closed on
Dec 10, 2002
Sold by
Rezendes Michele A and Rezendes Michael W
Bought by
Cottone Joseph and Cottone Franseca
Purchase Details
Closed on
Aug 11, 2000
Sold by
Pagatha Rt
Bought by
Rezendes Michael W and Rezendes Michele A
Purchase Details
Closed on
Dec 5, 1996
Sold by
Gerry Rita M and Gerry Donald D
Bought by
Armour A Robert and Armour Margaret P
Create a Home Valuation Report for This Property
The Home Valuation Report is an in-depth analysis detailing your home's value as well as a comparison with similar homes in the area
Home Values in the Area
Average Home Value in this Area
Purchase History
| Date | Buyer | Sale Price | Title Company |
|---|---|---|---|
| Bassford Kathy L | $352,000 | -- | |
| Bassford Kathy L | $352,000 | -- | |
| Cottone Joseph | $359,000 | -- | |
| Cottone Joseph | $359,000 | -- | |
| Rezendes Michael W | $222,500 | -- | |
| Rezendes Michael W | $222,500 | -- | |
| Armour A Robert | $158,000 | -- | |
| Armour A Robert A | $158,000 | -- |
Source: Public Records
Mortgage History
| Date | Status | Borrower | Loan Amount |
|---|---|---|---|
| Open | Armour A Robert A | $274,000 | |
| Closed | Bassford Kathy L | $281,600 |
Source: Public Records
Tax History Compared to Growth
Tax History
| Year | Tax Paid | Tax Assessment Tax Assessment Total Assessment is a certain percentage of the fair market value that is determined by local assessors to be the total taxable value of land and additions on the property. | Land | Improvement |
|---|---|---|---|---|
| 2025 | $5,595 | $716,400 | $296,700 | $419,700 |
| 2024 | $5,472 | $682,300 | $282,600 | $399,700 |
| 2023 | $5,320 | $603,900 | $250,100 | $353,800 |
| 2022 | $5,064 | $501,900 | $221,300 | $280,600 |
| 2021 | $4,921 | $456,900 | $201,400 | $255,500 |
| 2020 | $4,741 | $441,400 | $199,500 | $241,900 |
| 2019 | $4,331 | $412,100 | $199,500 | $212,600 |
| 2018 | $4,138 | $392,600 | $190,000 | $202,600 |
| 2017 | $4,030 | $391,300 | $188,200 | $203,100 |
| 2016 | $3,276 | $322,400 | $131,200 | $191,200 |
| 2015 | $3,247 | $322,400 | $131,200 | $191,200 |
Source: Public Records
Map
Nearby Homes
- 133 Phillips Rd
- 10 Tecumseh Rd
- 8 Driftwood Ln
- 368 Old Plymouth Rd
- 0 State Rd
- 4 Andrew Rd
- 17 Ridgehill Ln
- 11 Village Green Dr Unit B
- 19 Oak Bluff Rd
- 18 Gibbs Rd
- 30 Pawtuxet Rd
- 1 Kara's Way
- 896 Sandwich Rd
- 15 Nonantum Rd
- 92 Cliffside Dr Unit hole 2
- 51 Commonwealth Ave
- 51 Commonwealth Ave
- 26 Southcliff Dr Unit H-26
- 42 Fairway Dr Unit Golfview
- 150 Herring Pond Rd