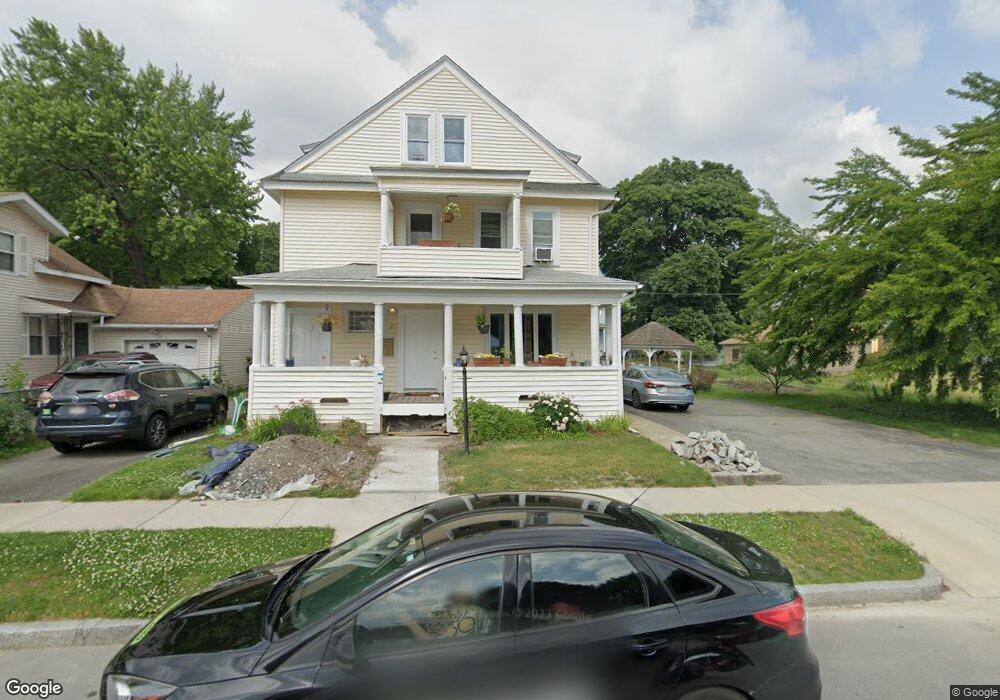
21 Carver St Worcester, MA 01604
Lake Park NeighborhoodEstimated Value: $665,000 - $766,000
7
Beds
3
Baths
3,585
Sq Ft
$202/Sq Ft
Est. Value
About This Home
This home is located at 21 Carver St, Worcester, MA 01604 and is currently estimated at $723,000, approximately $201 per square foot. 21 Carver St is a home located in Worcester County with nearby schools including Jacob Hiatt Magnet School, Chandler Magnet, and Lake View Elementary School.
Ownership History
Date
Name
Owned For
Owner Type
Purchase Details
Closed on
Apr 12, 2013
Sold by
John R Lapomardo T and Lapomardo John B
Bought by
Lapomardo Rocky J
Current Estimated Value
Home Financials for this Owner
Home Financials are based on the most recent Mortgage that was taken out on this home.
Original Mortgage
$60,000
Outstanding Balance
$42,505
Interest Rate
3.55%
Estimated Equity
$680,495
Purchase Details
Closed on
Sep 17, 2003
Sold by
Lapomardo John R and Lapomardo Maria
Bought by
Lapomardo John R
Purchase Details
Closed on
Jul 19, 2000
Sold by
Lopomardo Maria and Polselli Lucia
Bought by
Lampomardo John R and Lampomardo Maria
Home Financials for this Owner
Home Financials are based on the most recent Mortgage that was taken out on this home.
Original Mortgage
$75,000
Interest Rate
8.28%
Mortgage Type
Purchase Money Mortgage
Create a Home Valuation Report for This Property
The Home Valuation Report is an in-depth analysis detailing your home's value as well as a comparison with similar homes in the area
Home Values in the Area
Average Home Value in this Area
Purchase History
| Date | Buyer | Sale Price | Title Company |
|---|---|---|---|
| Lapomardo Rocky J | -- | -- | |
| Lapomardo John R | -- | -- | |
| Lampomardo John R | $75,000 | -- |
Source: Public Records
Mortgage History
| Date | Status | Borrower | Loan Amount |
|---|---|---|---|
| Open | Lapomardo Rocky J | $60,000 | |
| Previous Owner | Lampomardo John R | $75,000 |
Source: Public Records
Tax History
| Year | Tax Paid | Tax Assessment Tax Assessment Total Assessment is a certain percentage of the fair market value that is determined by local assessors to be the total taxable value of land and additions on the property. | Land | Improvement |
|---|---|---|---|---|
| 2025 | $8,641 | $655,100 | $118,700 | $536,400 |
| 2024 | $8,422 | $612,500 | $118,700 | $493,800 |
| 2023 | $7,791 | $543,300 | $103,200 | $440,100 |
| 2022 | $6,998 | $460,100 | $82,600 | $377,500 |
| 2021 | $5,719 | $351,300 | $66,100 | $285,200 |
| 2020 | $5,188 | $305,200 | $66,100 | $239,100 |
| 2019 | $5,375 | $298,600 | $59,500 | $239,100 |
| 2018 | $5,457 | $288,600 | $59,500 | $229,100 |
| 2017 | $5,180 | $269,500 | $59,500 | $210,000 |
| 2016 | $5,025 | $243,800 | $43,700 | $200,100 |
| 2015 | $4,893 | $243,800 | $43,700 | $200,100 |
| 2014 | $4,123 | $211,000 | $43,700 | $167,300 |
Source: Public Records
Map
Nearby Homes
- 35 Dustin St
- 51 Alvarado Ave Unit 204
- 65 Lake Ave Unit 1008
- 65 Lake Ave Unit 830
- 65 Lake Ave Unit 510
- 293 Harrington Way
- 28 Granby Rd
- 28 Adams St Unit 304
- 25 Johnson St
- 70 S Quinsigamond Ave Unit 5
- 29 Dominion Rd
- 256 Belmont St
- 28 Nonquit St
- 12 Brookside Place
- 241 Lake Ave
- 73 S Quinsigamond Ave
- 60 Shrewsbury Green Dr Unit B
- 18 Shrewsbury Green Dr Unit I
- 105 S Quinsigamond Ave
- 64 Wauwinet Rd
- 23 Carver St
- 20 Natick St
- 20 Natick St Unit 2nd Floor
- 22 Natick St
- 17 Carver St
- 25 Carver St
- 25 Carver St Unit 2
- 25 Carver St Unit 1
- 25 Carver St Unit 25
- 16 Natick St
- 22 Carver St
- 18 Carver St
- 26 Natick St
- 27 Carver St
- 26 Carver St
- 26 Carver St Unit 1
- 26 Carver St Unit 2nd
- 16 Carver St
- 31 Carver St
- 12 Natick St
Your Personal Tour Guide
Ask me questions while you tour the home.