21 Cathy Ln Brockton, MA 02301
Brockton Heights NeighborhoodEstimated payment $4,424/month
Highlights
- Golf Course Community
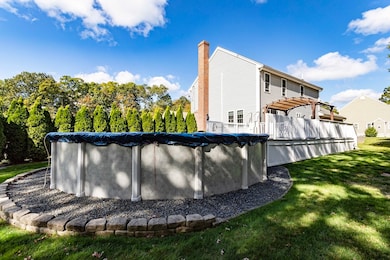
- Above Ground Pool
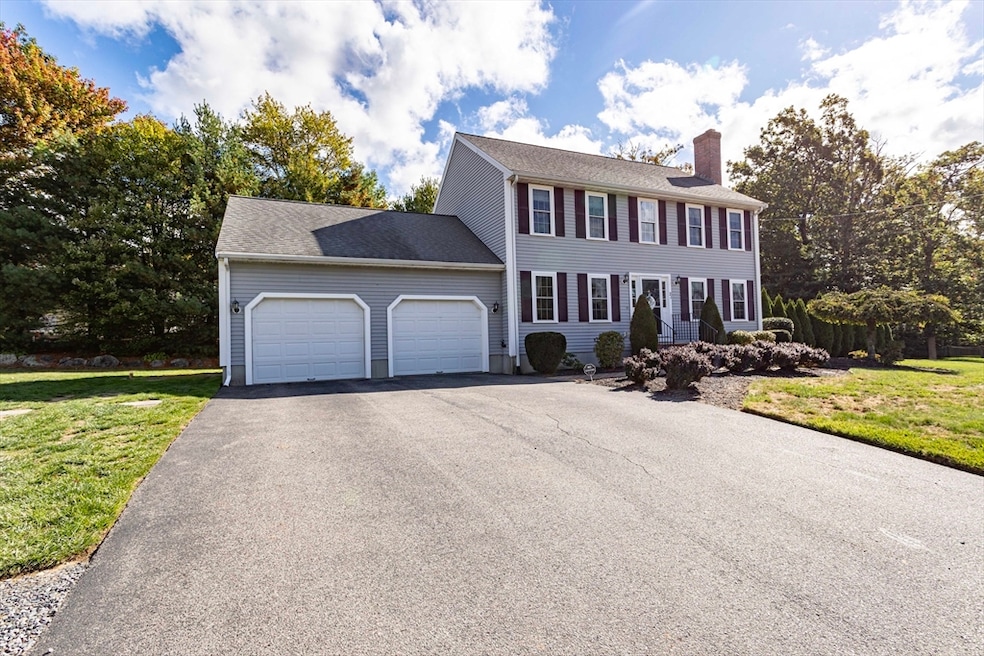
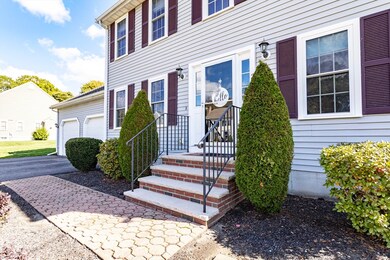
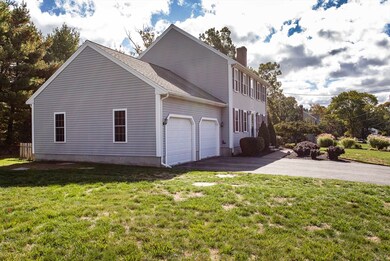
- Colonial Architecture
- Medical Services
- Open Floorplan
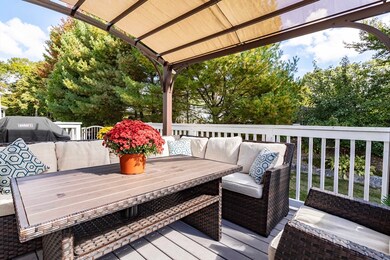
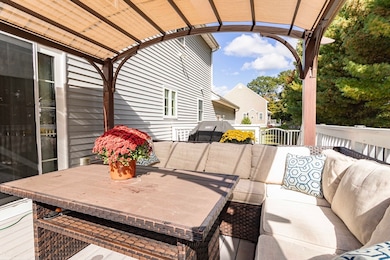
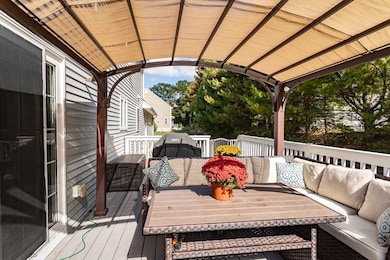
- Deck
About This Home
Nestled on a generous lot & perfectly located in one of Brockton's best subdivisions near the Easton Line, presents an attractive single-family residence in great condition. The heart of this home is undoubtedly the kitchen, where culinary dreams come to life amidst a large kitchen island, perfect for gathering and creating lasting memories; the kitchen bar offers a casual spot for morning coffee or relax in the all glassed in breakfast nook. Imagine cozy evenings in the living room, where the raised hearth brick fireplace provides a warm and inviting ambiance, ideal for relaxation and quiet reflection. Step outdoors to discover a private pool, offering a refreshing escape on warm days, and an outdoor dining area, perfect for al fresco meals and entertaining; the deck and pergola enhance the outdoor living space, creating a serene retreat for relaxation and enjoyment. Very spacious lower level family/game/tv room. 2 car attached garage, CVAC & generator connection. All appliances stay.
Home Details
Home Type
- Single Family
Est. Annual Taxes
- $7,146
Year Built
- Built in 2004
Lot Details
- 0.48 Acre Lot
- Sprinkler System
- Cleared Lot
- Property is zoned R1B
Parking
- 2 Car Attached Garage
- Garage Door Opener
- Driveway
- Open Parking
- Off-Street Parking
Home Design
- Colonial Architecture
- Concrete Perimeter Foundation
Interior Spaces
- Open Floorplan
- Central Vacuum
- Cathedral Ceiling
- Ceiling Fan
- Recessed Lighting
- Light Fixtures
- Insulated Windows
- Window Screens
- Sliding Doors
- Living Room with Fireplace
- Dining Area
- Storm Doors
Kitchen
- Breakfast Area or Nook
- Breakfast Bar
- Range
- Microwave
- Plumbed For Ice Maker
- Dishwasher
- Kitchen Island
Flooring
- Wood
- Wall to Wall Carpet
- Ceramic Tile
Bedrooms and Bathrooms
- 4 Bedrooms
- Primary bedroom located on second floor
- 2 Full Bathrooms
- Double Vanity
- Bathtub with Shower
- Separate Shower
Laundry
- Laundry on main level
- Dryer
- Washer
Partially Finished Basement
- Basement Fills Entire Space Under The House
- Interior and Exterior Basement Entry
Eco-Friendly Details
- Whole House Vacuum System
Outdoor Features
- Above Ground Pool
- Bulkhead
- Deck
- Rain Gutters
Location
- Property is near public transit
- Property is near schools
Schools
- Hancock Elementary School
- West Junior Middle School
- BHS Or Spellman High School
Utilities
- Central Air
- 1 Cooling Zone
- 3 Heating Zones
- Heating System Uses Oil
- Baseboard Heating
- Generator Hookup
- Power Generator
- Tankless Water Heater
- Cable TV Available
Listing and Financial Details
- Assessor Parcel Number M:002 R:213 S:,948621
Community Details
Overview
- No Home Owners Association
Amenities
- Medical Services
- Shops
Recreation
- Golf Course Community
Map
Home Values in the Area
Average Home Value in this Area
Tax History
| Year | Tax Paid | Tax Assessment Tax Assessment Total Assessment is a certain percentage of the fair market value that is determined by local assessors to be the total taxable value of land and additions on the property. | Land | Improvement |
|---|---|---|---|---|
| 2025 | $7,146 | $590,100 | $181,800 | $408,300 |
| 2024 | $6,967 | $579,600 | $181,800 | $397,800 |
| 2023 | $6,659 | $513,000 | $133,500 | $379,500 |
| 2022 | $6,161 | $441,000 | $121,300 | $319,700 |
| 2021 | $6,020 | $415,200 | $107,100 | $308,100 |
| 2020 | $6,337 | $418,300 | $104,900 | $313,400 |
| 2019 | $6,101 | $392,600 | $100,800 | $291,800 |
| 2018 | $5,799 | $361,100 | $100,800 | $260,300 |
| 2017 | $5,806 | $360,600 | $100,800 | $259,800 |
| 2016 | $5,890 | $339,300 | $96,800 | $242,500 |
| 2015 | $5,592 | $308,100 | $96,800 | $211,300 |
| 2014 | $5,633 | $310,700 | $96,800 | $213,900 |
Property History
| Date | Event | Price | List to Sale | Price per Sq Ft |
|---|---|---|---|---|
| 10/08/2025 10/08/25 | Pending | -- | -- | -- |
| 10/05/2025 10/05/25 | For Sale | $729,900 | -- | $322 / Sq Ft |
Purchase History
| Date | Type | Sale Price | Title Company |
|---|---|---|---|
| Land Court Massachusetts | $125,000 | -- |
Mortgage History
| Date | Status | Loan Amount | Loan Type |
|---|---|---|---|
| Open | $307,700 | Purchase Money Mortgage |
Source: MLS Property Information Network (MLS PIN)
MLS Number: 73439887
APN: BROC-000002-000213
Disclaimer: Certain information contained herein is derived from information provided by parties other than Homes.com. All information provided is deemed reliable, but is not guaranteed to be accurate and should be independently verified.
![]() The property listing data and information, or the Images, set forth herein were provided to MLS Property Information Network, Inc. from third party sources, including sellers, lessors and public records, and were compiled by MLS Property Information Network, Inc. The property listing data and information, and the Images, are for the personal, non-commercial use of consumers having a good faith interest in purchasing or leasing listed properties of the type displayed to them and may not be used for any purpose other than to identify prospective properties which such consumers may have a good faith interest in purchasing or leasing. MLS Property Information Network, Inc. and its subscribers disclaim any and all representations and warranties as to the accuracy of the property listing data and information, or as to the accuracy of any of the Images, set forth herein.
The property listing data and information, or the Images, set forth herein were provided to MLS Property Information Network, Inc. from third party sources, including sellers, lessors and public records, and were compiled by MLS Property Information Network, Inc. The property listing data and information, and the Images, are for the personal, non-commercial use of consumers having a good faith interest in purchasing or leasing listed properties of the type displayed to them and may not be used for any purpose other than to identify prospective properties which such consumers may have a good faith interest in purchasing or leasing. MLS Property Information Network, Inc. and its subscribers disclaim any and all representations and warranties as to the accuracy of the property listing data and information, or as to the accuracy of any of the Images, set forth herein.
- 51 Rangeley Ave
- 98 Union St
- 29 Bower Ave
- 117 Healey Terrace
- 95 Union St
- LOT 4 Winterberry Ln
- Lot 2 Winterberry Ln
- 86 Union St
- 110 Union St
- Lot 1 Winterberry Ln
- 102 Alandale Ave
- 96 Winterberry Ln
- 78 Keene St
- 14 Marshall Rd
- 10 Felton St Unit 208
- 197 Candy Ln
- 93 McEachron Dr
- 0 Atkinson Ave
- 10 Westbury Rd
- 0 Reservoir St
