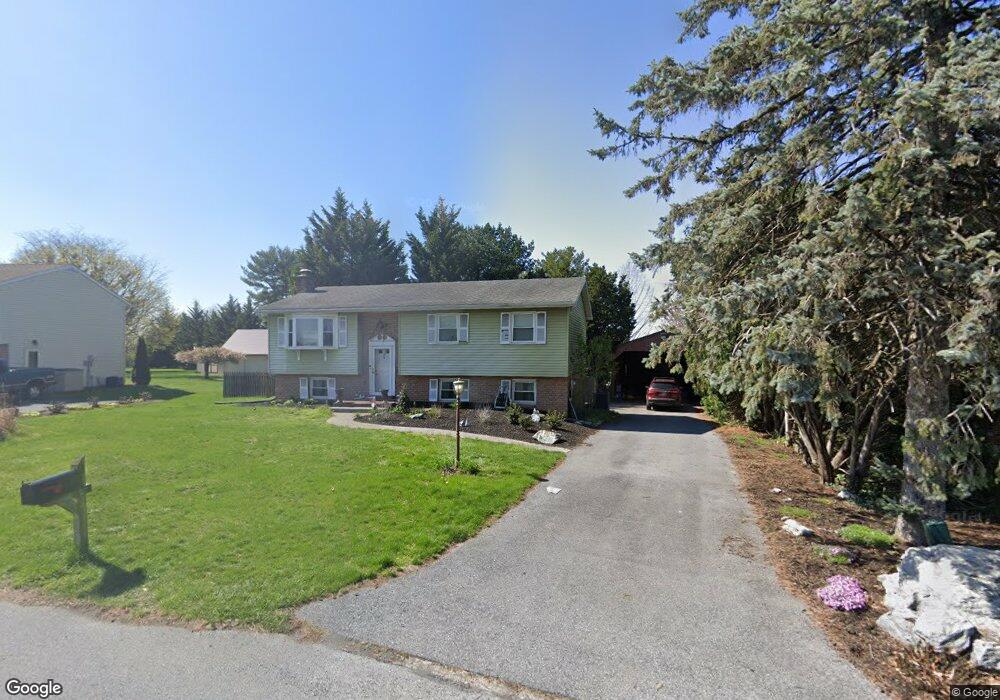
21 Cedar Ave Ephrata, PA 17522
Estimated Value: $358,075 - $394,000
3
Beds
2
Baths
1,804
Sq Ft
$209/Sq Ft
Est. Value
About This Home
This home is located at 21 Cedar Ave, Ephrata, PA 17522 and is currently estimated at $377,019, approximately $208 per square foot. 21 Cedar Ave is a home located in Lancaster County with nearby schools including Brownstown El School, Gerald G. Huesken Middle School, and Conestoga Valley High School.
Ownership History
Date
Name
Owned For
Owner Type
Purchase Details
Closed on
Oct 29, 2010
Sold by
Weaver Dwayne K and Weaver Stephanie J
Bought by
Dise Michael L and Dise Lisa K
Current Estimated Value
Home Financials for this Owner
Home Financials are based on the most recent Mortgage that was taken out on this home.
Original Mortgage
$183,528
Outstanding Balance
$119,537
Interest Rate
4.25%
Mortgage Type
FHA
Estimated Equity
$257,482
Create a Home Valuation Report for This Property
The Home Valuation Report is an in-depth analysis detailing your home's value as well as a comparison with similar homes in the area
Home Values in the Area
Average Home Value in this Area
Purchase History
| Date | Buyer | Sale Price | Title Company |
|---|---|---|---|
| Dise Michael L | $186,000 | First American Title Ins Co |
Source: Public Records
Mortgage History
| Date | Status | Borrower | Loan Amount |
|---|---|---|---|
| Open | Dise Michael L | $183,528 |
Source: Public Records
Tax History Compared to Growth
Tax History
| Year | Tax Paid | Tax Assessment Tax Assessment Total Assessment is a certain percentage of the fair market value that is determined by local assessors to be the total taxable value of land and additions on the property. | Land | Improvement |
|---|---|---|---|---|
| 2025 | $3,193 | $160,400 | $51,300 | $109,100 |
| 2024 | $3,193 | $160,400 | $51,300 | $109,100 |
| 2023 | $3,118 | $160,400 | $51,300 | $109,100 |
| 2022 | $2,992 | $160,400 | $51,300 | $109,100 |
| 2021 | $2,883 | $160,400 | $51,300 | $109,100 |
| 2020 | $2,883 | $160,400 | $51,300 | $109,100 |
| 2019 | $2,818 | $160,400 | $51,300 | $109,100 |
| 2018 | $4,105 | $160,400 | $51,300 | $109,100 |
| 2017 | $2,915 | $137,200 | $31,800 | $105,400 |
| 2016 | $2,915 | $137,200 | $31,800 | $105,400 |
| 2015 | $731 | $137,200 | $31,800 | $105,400 |
| 2014 | $1,939 | $137,200 | $31,800 | $105,400 |
Source: Public Records
Map
Nearby Homes