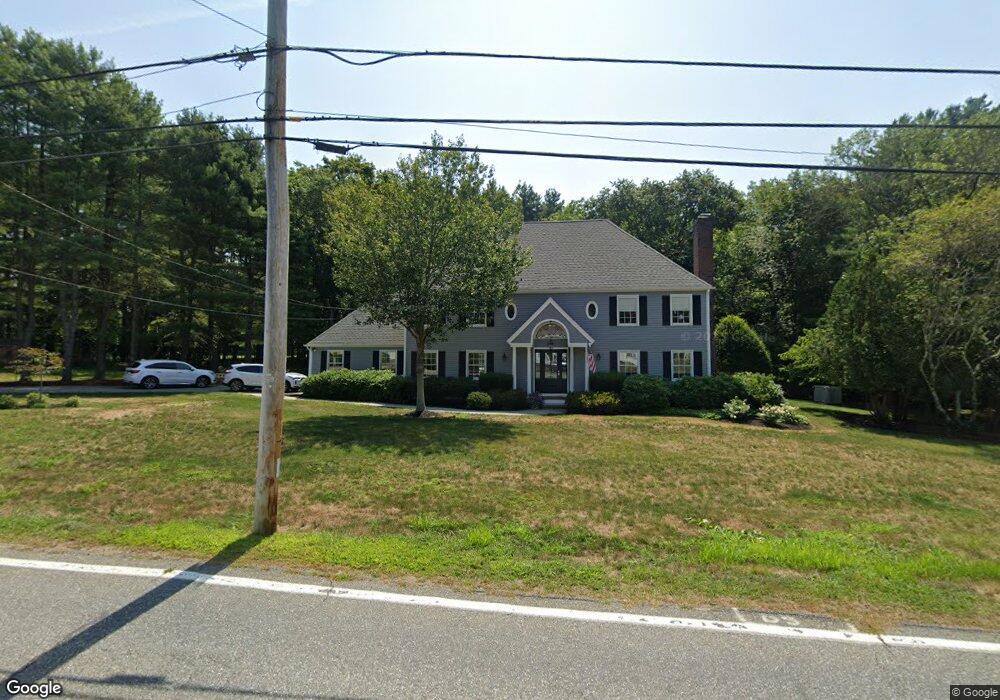
21 Cedar St Wenham, MA 01984
Estimated Value: $1,297,018 - $1,457,000
4
Beds
3
Baths
2,810
Sq Ft
$490/Sq Ft
Est. Value
About This Home
This home is located at 21 Cedar St, Wenham, MA 01984 and is currently estimated at $1,377,255, approximately $490 per square foot. 21 Cedar St is a home located in Essex County with nearby schools including Winthrop School, Bessie Buker Elementary School, and Cutler Elementary School.
Ownership History
Date
Name
Owned For
Owner Type
Purchase Details
Closed on
Aug 16, 2013
Sold by
Carter Martha J
Bought by
Carter Martha J and Roickle Mary A
Current Estimated Value
Purchase Details
Closed on
Oct 11, 1994
Sold by
Lowery Brinck
Bought by
Carter Martha J
Home Financials for this Owner
Home Financials are based on the most recent Mortgage that was taken out on this home.
Original Mortgage
$208,000
Interest Rate
8.55%
Mortgage Type
Purchase Money Mortgage
Purchase Details
Closed on
Jul 31, 1992
Sold by
Sursum S A
Bought by
Lowery Brinck
Purchase Details
Closed on
Mar 5, 1987
Sold by
Cedar Street Rt
Bought by
Sursum S A
Create a Home Valuation Report for This Property
The Home Valuation Report is an in-depth analysis detailing your home's value as well as a comparison with similar homes in the area
Home Values in the Area
Average Home Value in this Area
Purchase History
| Date | Buyer | Sale Price | Title Company |
|---|---|---|---|
| Carter Martha J | -- | -- | |
| Carter Martha J | $385,000 | -- | |
| Lowery Brinck | $260,000 | -- | |
| Carter Martha J | -- | -- | |
| Carter Martha J | $385,000 | -- | |
| Lowery Brinck | $260,000 | -- | |
| Sursum S A | $459,500 | -- |
Source: Public Records
Mortgage History
| Date | Status | Borrower | Loan Amount |
|---|---|---|---|
| Previous Owner | Sursum S A | $200,000 | |
| Previous Owner | Sursum S A | $208,000 |
Source: Public Records
Tax History
| Year | Tax Paid | Tax Assessment Tax Assessment Total Assessment is a certain percentage of the fair market value that is determined by local assessors to be the total taxable value of land and additions on the property. | Land | Improvement |
|---|---|---|---|---|
| 2025 | $16,410 | $1,056,000 | $427,900 | $628,100 |
| 2024 | $15,726 | $1,004,200 | $427,900 | $576,300 |
| 2023 | $14,505 | $836,000 | $538,700 | $297,300 |
| 2022 | $14,797 | $755,700 | $453,300 | $302,400 |
| 2021 | $14,185 | $720,800 | $418,400 | $302,400 |
| 2020 | $13,214 | $697,700 | $419,300 | $278,400 |
| 2019 | $12,573 | $697,700 | $419,300 | $278,400 |
| 2018 | $12,259 | $652,400 | $405,800 | $246,600 |
| 2017 | $11,958 | $652,400 | $405,800 | $246,600 |
| 2016 | $11,078 | $652,400 | $405,800 | $246,600 |
| 2015 | $10,602 | $652,400 | $405,800 | $246,600 |
Source: Public Records
Map
Nearby Homes
Your Personal Tour Guide
Ask me questions while you tour the home.