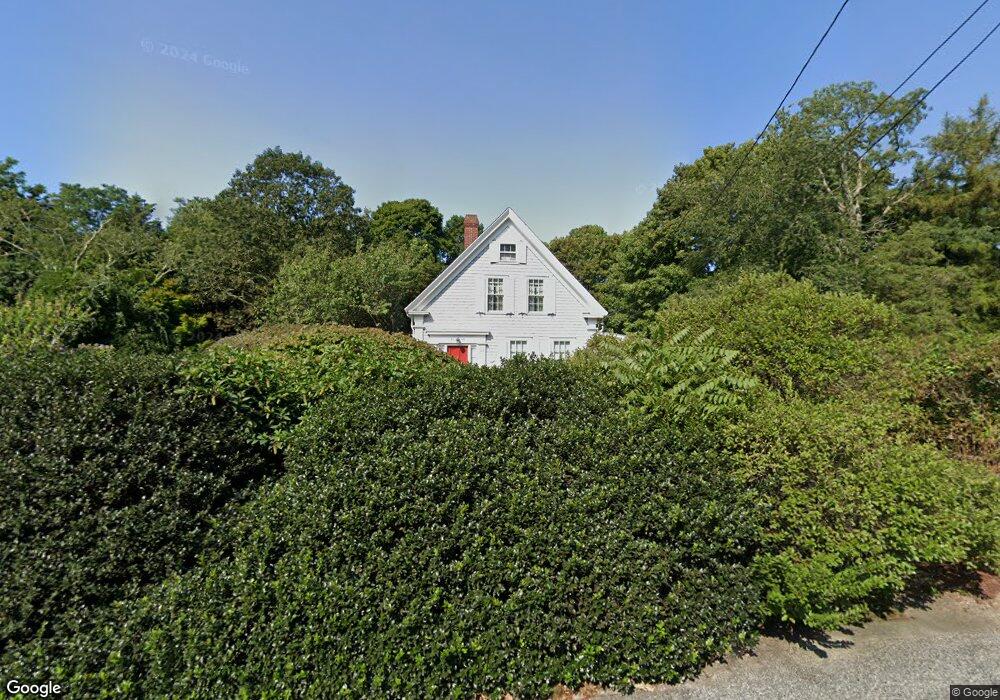
21 Center St Yarmouth Port, MA 02675
Yarmouth Port NeighborhoodEstimated Value: $920,085 - $1,374,000
4
Beds
3
Baths
2,588
Sq Ft
$422/Sq Ft
Est. Value
About This Home
This home is located at 21 Center St, Yarmouth Port, MA 02675 and is currently estimated at $1,091,271, approximately $421 per square foot. 21 Center St is a home located in Barnstable County with nearby schools including Dennis-Yarmouth Regional High School, St. Pius X. School, and Trinity Christian Academy of Cape Cod.
Ownership History
Date
Name
Owned For
Owner Type
Purchase Details
Closed on
Feb 2, 2016
Sold by
Gray Paul F and Gray Barbara H
Bought by
Arbara Paul and Arbara Gray T
Current Estimated Value
Purchase Details
Closed on
Feb 1, 2013
Sold by
Suzanne B Moyer Ret
Bought by
Gray Paul F and Gray Barbara H
Purchase Details
Closed on
Apr 29, 2008
Sold by
Moyer Suzanne B
Bought by
Suzanne B Moyer Ret and Moyer Suzanne B
Purchase Details
Closed on
Aug 11, 1998
Sold by
Schneider Leslie Ann
Bought by
Moyer Suzanne B
Home Financials for this Owner
Home Financials are based on the most recent Mortgage that was taken out on this home.
Original Mortgage
$238,000
Interest Rate
6.92%
Mortgage Type
Purchase Money Mortgage
Create a Home Valuation Report for This Property
The Home Valuation Report is an in-depth analysis detailing your home's value as well as a comparison with similar homes in the area
Home Values in the Area
Average Home Value in this Area
Purchase History
| Date | Buyer | Sale Price | Title Company |
|---|---|---|---|
| Arbara Paul | -- | -- | |
| Gray Paul F | $640,000 | -- | |
| Suzanne B Moyer Ret | -- | -- | |
| Moyer Suzanne B | $298,000 | -- |
Source: Public Records
Mortgage History
| Date | Status | Borrower | Loan Amount |
|---|---|---|---|
| Previous Owner | Moyer Suzanne B | $228,000 | |
| Previous Owner | Moyer Suzanne B | $29,000 | |
| Previous Owner | Moyer Suzanne B | $238,000 | |
| Previous Owner | Moyer Suzanne B | $166,500 |
Source: Public Records
Tax History Compared to Growth
Tax History
| Year | Tax Paid | Tax Assessment Tax Assessment Total Assessment is a certain percentage of the fair market value that is determined by local assessors to be the total taxable value of land and additions on the property. | Land | Improvement |
|---|---|---|---|---|
| 2025 | $5,205 | $735,100 | $345,600 | $389,500 |
| 2024 | $4,994 | $676,700 | $324,900 | $351,800 |
| 2023 | $5,108 | $629,900 | $273,100 | $356,800 |
| 2022 | $4,731 | $515,400 | $221,200 | $294,200 |
| 2021 | $4,574 | $478,400 | $234,600 | $243,800 |
| 2020 | $4,924 | $492,400 | $218,300 | $274,100 |
| 2019 | $4,973 | $492,400 | $218,300 | $274,100 |
| 2018 | $5,067 | $492,400 | $218,300 | $274,100 |
| 2017 | $4,934 | $492,400 | $218,300 | $274,100 |
| 2016 | $4,716 | $472,500 | $198,400 | $274,100 |
| 2015 | $5,026 | $500,600 | $198,400 | $302,200 |
Source: Public Records
Map
Nearby Homes
- 404 Route 6a
- 19 Phoebes Ln
- 463 Route 6a
- 1016 W West Yarmouth Rd
- 23 Dauphine Dr
- 882 W Yarmouth Rd
- 170 Pine St
- 186 Route 6a
- 68 Seminole Dr
- 162 Route 6a
- 209 Union St
- 2 Pine Grove
- 55 W West Woods Cir
- 25 Oak Glen
- 55 W Woods
- 25 Oak Glen Village Unit 25
- 21 Boxwood Cir
- 28 Oak Glen
- 9 Forest Gate
- 30 W Woods Cir Unit 30