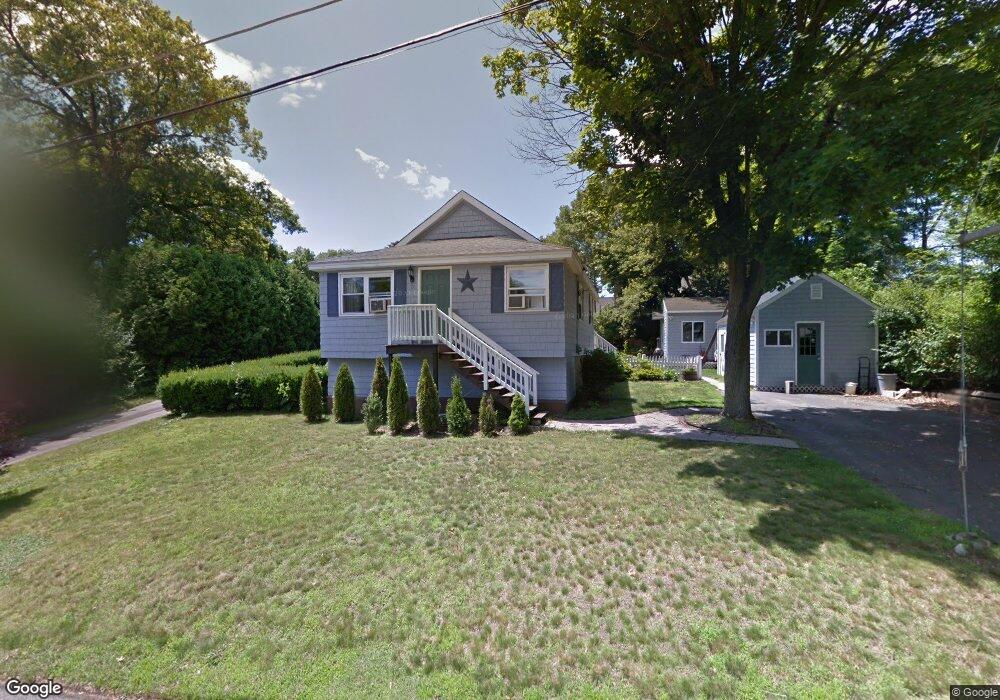
21 Chapman St Unit Single Walpole, MA 02081
Estimated Value: $547,307 - $613,000
3
Beds
1
Bath
1,280
Sq Ft
$450/Sq Ft
Est. Value
About This Home
This home is located at 21 Chapman St Unit Single, Walpole, MA 02081 and is currently estimated at $575,827, approximately $449 per square foot. 21 Chapman St Unit Single is a home located in Norfolk County with nearby schools including Fisher School, Walpole Middle School, and Walpole High School.
Ownership History
Date
Name
Owned For
Owner Type
Purchase Details
Closed on
Aug 2, 2013
Sold by
Bemko Morgan and Bemko Christine A
Bought by
Moleca Sandra
Current Estimated Value
Home Financials for this Owner
Home Financials are based on the most recent Mortgage that was taken out on this home.
Original Mortgage
$273,000
Outstanding Balance
$199,402
Interest Rate
3.95%
Mortgage Type
New Conventional
Estimated Equity
$376,425
Purchase Details
Closed on
Jan 23, 2013
Sold by
Bemko Morgan and Bemko Christine A
Bought by
Bemko Morgan and Bemko Christine A
Home Financials for this Owner
Home Financials are based on the most recent Mortgage that was taken out on this home.
Original Mortgage
$267,323
Interest Rate
4.4%
Mortgage Type
FHA
Purchase Details
Closed on
Dec 3, 2008
Sold by
Bemko Morgan
Bought by
Leggett Christine A and Bemko Morgan
Purchase Details
Closed on
Mar 31, 2008
Sold by
Ferri Michelle D and Ferri Peter E
Bought by
Bemko Morgan
Home Financials for this Owner
Home Financials are based on the most recent Mortgage that was taken out on this home.
Original Mortgage
$239,426
Interest Rate
5.76%
Mortgage Type
Purchase Money Mortgage
Purchase Details
Closed on
Apr 1, 1998
Sold by
Rea John R and Rea Mary J
Bought by
Ferri Peter E and Ferri Michelle D
Create a Home Valuation Report for This Property
The Home Valuation Report is an in-depth analysis detailing your home's value as well as a comparison with similar homes in the area
Home Values in the Area
Average Home Value in this Area
Purchase History
| Date | Buyer | Sale Price | Title Company |
|---|---|---|---|
| Moleca Sandra | $288,000 | -- | |
| Bemko Morgan | -- | -- | |
| Leggett Christine A | -- | -- | |
| Bemko Morgan | $252,000 | -- | |
| Ferri Peter E | $121,500 | -- |
Source: Public Records
Mortgage History
| Date | Status | Borrower | Loan Amount |
|---|---|---|---|
| Open | Moleca Sandra | $273,000 | |
| Previous Owner | Ferri Peter E | $267,323 | |
| Previous Owner | Ferri Peter E | $282,254 | |
| Previous Owner | Bemko Morgan | $239,426 | |
| Previous Owner | Ferri Peter E | $25,400 |
Source: Public Records
Tax History Compared to Growth
Tax History
| Year | Tax Paid | Tax Assessment Tax Assessment Total Assessment is a certain percentage of the fair market value that is determined by local assessors to be the total taxable value of land and additions on the property. | Land | Improvement |
|---|---|---|---|---|
| 2025 | $5,740 | $447,400 | $284,600 | $162,800 |
| 2024 | $5,555 | $420,200 | $273,600 | $146,600 |
| 2023 | $5,431 | $391,000 | $237,900 | $153,100 |
| 2022 | $5,120 | $354,100 | $220,300 | $133,800 |
| 2021 | $4,862 | $327,600 | $207,800 | $119,800 |
| 2020 | $4,923 | $328,400 | $196,100 | $132,300 |
| 2019 | $4,734 | $313,500 | $188,600 | $124,900 |
| 2018 | $4,364 | $285,800 | $181,200 | $104,600 |
| 2017 | $4,243 | $276,800 | $174,200 | $102,600 |
| 2016 | $4,075 | $261,900 | $167,400 | $94,500 |
| 2015 | $3,923 | $249,900 | $159,100 | $90,800 |
| 2014 | $3,724 | $236,300 | $159,100 | $77,200 |
Source: Public Records
Map
Nearby Homes
- 291 Plimpton St
- 66 Gould St
- 22 Coolidge Rd
- 634 Main St Unit 14
- 21 Spear Ave
- 4403 Pennington Dr Unit 4403
- 363 - 367 Washington St
- 7 Washington Green
- 486 Washington St
- 2213 Pennington Dr Unit 2213
- 2 Alexandra Way
- 19 and 23 Arlington Ln
- 531 Walpole St
- 8 Rainbow Pond Dr Unit 8
- 20 Rockhill St
- 224 School St Unit 10
- 103 Centre Ln
- 11 Park Ln
- 305 Centre Ln
- 20 Rockhill St