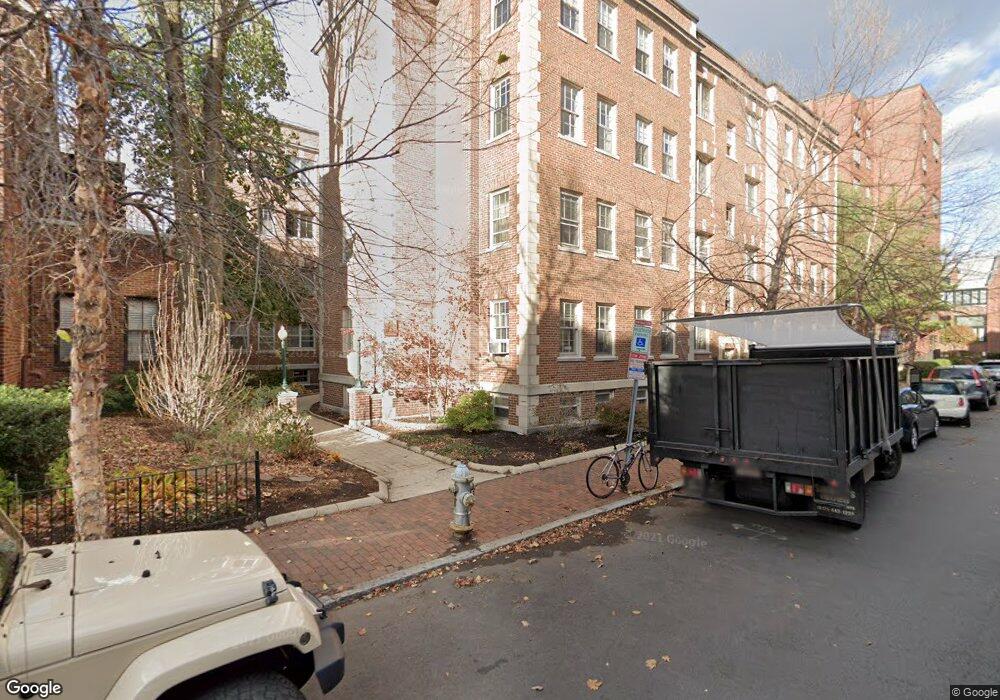
21 Chauncy St Unit 42 Cambridge, MA 02138
Neighborhood Nine NeighborhoodEstimated Value: $657,000 - $831,000
2
Beds
3
Baths
1,000
Sq Ft
$730/Sq Ft
Est. Value
About This Home
This home is located at 21 Chauncy St Unit 42, Cambridge, MA 02138 and is currently estimated at $729,819, approximately $729 per square foot. 21 Chauncy St Unit 42 is a home located in Middlesex County with nearby schools including St Peter School, Cambridge Montessori School, and Cambridge Friends School.
Ownership History
Date
Name
Owned For
Owner Type
Purchase Details
Closed on
Aug 22, 2001
Sold by
Randolph Penelope F
Bought by
Lecerf Jean-Michel and Lecerf-Ghaffari Sarah
Current Estimated Value
Home Financials for this Owner
Home Financials are based on the most recent Mortgage that was taken out on this home.
Original Mortgage
$228,000
Outstanding Balance
$89,325
Interest Rate
7.21%
Mortgage Type
Purchase Money Mortgage
Estimated Equity
$640,494
Purchase Details
Closed on
Sep 29, 1993
Sold by
Steinbergh Educt Daid
Bought by
Randolph Penelope D
Home Financials for this Owner
Home Financials are based on the most recent Mortgage that was taken out on this home.
Original Mortgage
$57,600
Interest Rate
7%
Mortgage Type
Purchase Money Mortgage
Purchase Details
Closed on
Dec 20, 1989
Sold by
Asb T
Bought by
Steinbergh David S
Home Financials for this Owner
Home Financials are based on the most recent Mortgage that was taken out on this home.
Original Mortgage
$15,325
Interest Rate
9.69%
Mortgage Type
Purchase Money Mortgage
Create a Home Valuation Report for This Property
The Home Valuation Report is an in-depth analysis detailing your home's value as well as a comparison with similar homes in the area
Home Values in the Area
Average Home Value in this Area
Purchase History
| Date | Buyer | Sale Price | Title Company |
|---|---|---|---|
| Lecerf Jean-Michel | $285,000 | -- | |
| Randolph Penelope D | $72,000 | -- | |
| Steinbergh David S | $23,825 | -- |
Source: Public Records
Mortgage History
| Date | Status | Borrower | Loan Amount |
|---|---|---|---|
| Open | Steinbergh David S | $228,000 | |
| Previous Owner | Steinbergh David S | $57,600 | |
| Previous Owner | Steinbergh David S | $15,325 |
Source: Public Records
Tax History
| Year | Tax Paid | Tax Assessment Tax Assessment Total Assessment is a certain percentage of the fair market value that is determined by local assessors to be the total taxable value of land and additions on the property. | Land | Improvement |
|---|---|---|---|---|
| 2025 | $4,387 | $690,800 | $0 | $690,800 |
| 2024 | $4,030 | $680,800 | $0 | $680,800 |
| 2023 | $3,946 | $673,300 | $0 | $673,300 |
| 2022 | $4,004 | $676,400 | $0 | $676,400 |
| 2021 | $3,920 | $670,000 | $0 | $670,000 |
| 2020 | $3,764 | $654,600 | $0 | $654,600 |
| 2019 | $3,603 | $606,500 | $0 | $606,500 |
| 2018 | $3,497 | $555,900 | $0 | $555,900 |
| 2017 | $3,368 | $519,000 | $0 | $519,000 |
| 2016 | $3,233 | $462,500 | $0 | $462,500 |
| 2015 | $3,197 | $408,800 | $0 | $408,800 |
| 2014 | $3,143 | $375,000 | $0 | $375,000 |
Source: Public Records
Map
Nearby Homes
- 58 Shepard St
- 16 Chauncy St Unit 53
- 44 Garden St
- 14 Concord Ave Unit 624
- 22 Concord Ave Unit 10
- 22 Concord Ave Unit 11
- 2 Avon St Unit 6
- 1580 Massachusetts Ave Unit 7C
- 4 Craigie St Unit 2
- 50 Follen St Unit 306
- 79 Martin St Unit 21
- 11 Wright St Unit 1
- 3 Berkeley Place
- 8 Wright St Unit 2
- 1619 Massachusetts Ave Unit 37
- 42 Linnaean St Unit 15
- 43 Linnaean St Unit 1
- 41 Bowdoin St Unit 33
- 12 Martin St
- 84 Garden St
- 21 Chauncy St Unit 25
- 21 Chauncy St Unit 48
- 21 Chauncy St Unit 47
- 21 Chauncy St Unit 46
- 21 Chauncy St Unit 45
- 21 Chauncy St Unit 43
- 21 Chauncy St Unit 41
- 21 Chauncy St Unit 3B
- 21 Chauncy St Unit 38
- 21 Chauncy St Unit 37
- 21 Chauncy St Unit 36
- 21 Chauncy St Unit 35
- 21 Chauncy St Unit 34
- 21 Chauncy St Unit 33
- 21 Chauncy St Unit 32
- 21 Chauncy St Unit 31
- 21 Chauncy St Unit 2B
- 21 Chauncy St Unit 28
- 21 Chauncy St Unit 27
- 21 Chauncy St Unit 26
Your Personal Tour Guide
Ask me questions while you tour the home.