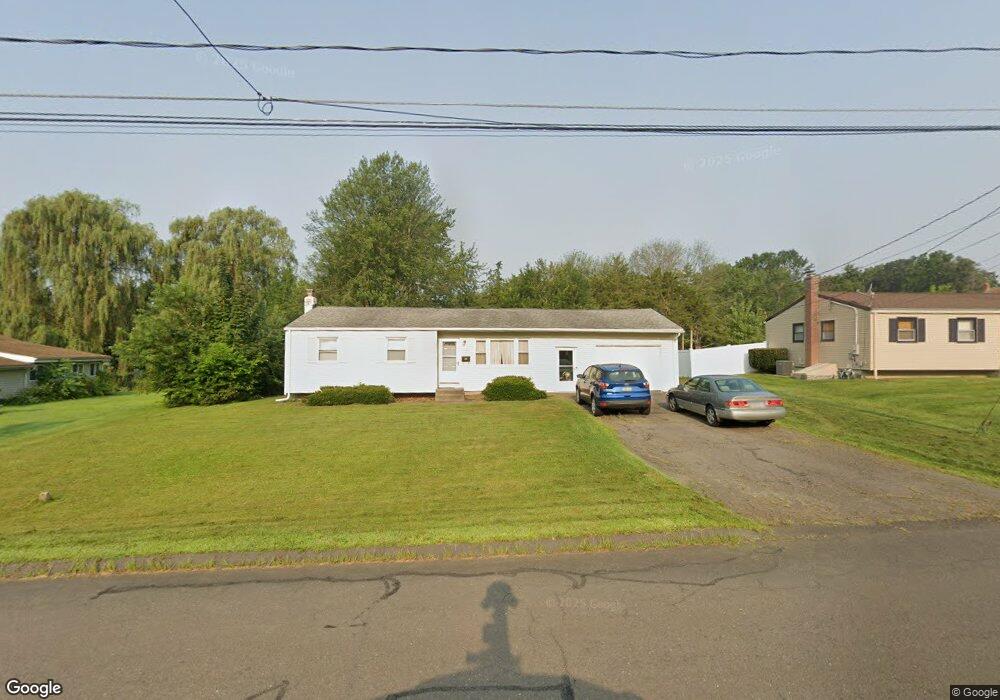
21 Chester Dr Windsor Locks, CT 06096
Estimated Value: $279,424 - $309,000
3
Beds
2
Baths
967
Sq Ft
$303/Sq Ft
Est. Value
About This Home
This home is located at 21 Chester Dr, Windsor Locks, CT 06096 and is currently estimated at $293,356, approximately $303 per square foot. 21 Chester Dr is a home located in Hartford County with nearby schools including North Street School, South Elementary School, and Windsor Locks Middle School.
Ownership History
Date
Name
Owned For
Owner Type
Purchase Details
Closed on
Nov 29, 2001
Sold by
Lamenzo Ralph and Lamenzo Ida
Bought by
Santabarbara Ralph and Santabarbara Susan
Current Estimated Value
Purchase Details
Closed on
Sep 20, 1996
Sold by
Lynch George P and Lynch Nina C
Bought by
Vanvleck Elfrida D
Create a Home Valuation Report for This Property
The Home Valuation Report is an in-depth analysis detailing your home's value as well as a comparison with similar homes in the area
Home Values in the Area
Average Home Value in this Area
Purchase History
We collect this data history from publicly available records. To have your information removed, we recommend requesting removal directly through your county’s website.
| Date | Buyer | Sale Price | Title Company |
|---|---|---|---|
| Santabarbara Ralph | $127,900 | -- | |
| Vanvleck Elfrida D | $222,500 | -- |
Source: Public Records
Mortgage History
We collect this data history from publicly available records. To have your information removed, we recommend requesting removal directly through your county’s website.
| Date | Status | Borrower | Loan Amount |
|---|---|---|---|
| Open | Vanvleck Elfrida D | $15,000 | |
| Open | Vanvleck Elfrida D | $121,500 | |
| Closed | Vanvleck Elfrida D | $25,000 | |
| Closed | Vanvleck Elfrida D | $115,700 |
Source: Public Records
Tax History
| Year | Tax Paid | Tax Assessment Tax Assessment Total Assessment is a certain percentage of the fair market value that is determined by local assessors to be the total taxable value of land and additions on the property. | Land | Improvement |
|---|---|---|---|---|
| 2025 | $4,423 | $184,380 | $58,940 | $125,440 |
| 2024 | $3,018 | $107,240 | $44,170 | $63,070 |
| 2023 | $2,824 | $107,240 | $44,170 | $63,070 |
| 2022 | $2,770 | $107,240 | $44,170 | $63,070 |
| 2021 | $2,770 | $107,240 | $44,170 | $63,070 |
| 2020 | $2,770 | $107,240 | $44,170 | $63,070 |
| 2019 | $2,770 | $107,240 | $44,170 | $63,070 |
| 2017 | $2,610 | $97,900 | $42,200 | $55,700 |
| 2016 | $2,610 | $97,900 | $42,200 | $55,700 |
| 2015 | $2,623 | $97,900 | $42,200 | $55,700 |
| 2014 | $3,045 | $116,100 | $48,000 | $68,100 |
Source: Public Records
Map
Nearby Homes
Your Personal Tour Guide
Ask me questions while you tour the home.