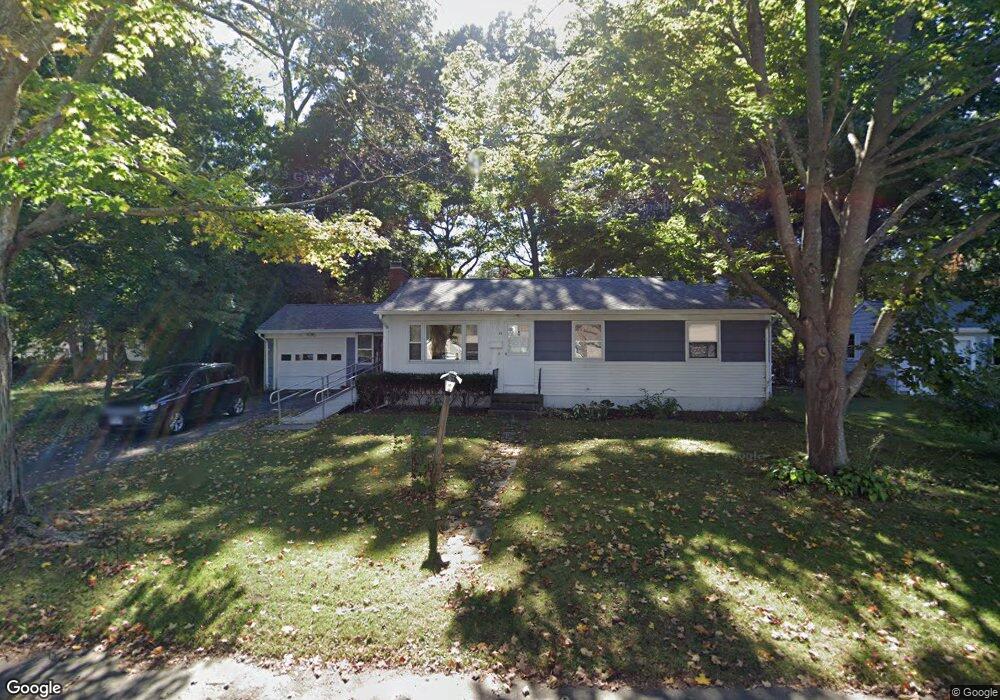
21 Chestnut Hill Rd Groton, CT 06340
Estimated Value: $379,849 - $475,000
3
Beds
1
Bath
1,212
Sq Ft
$338/Sq Ft
Est. Value
About This Home
This home is located at 21 Chestnut Hill Rd, Groton, CT 06340 and is currently estimated at $409,212, approximately $337 per square foot. 21 Chestnut Hill Rd is a home located in New London County with nearby schools including Catherine Kolnaski STEAM Magnet School, Groton Middle School, and Robert E. Fitch High School.
Ownership History
Date
Name
Owned For
Owner Type
Purchase Details
Closed on
Jun 20, 2016
Sold by
Macgeachie Alan G
Bought by
Macgeachie Alan G and Macgeachie Carol E
Current Estimated Value
Purchase Details
Closed on
Nov 5, 2009
Sold by
Citibank Na
Bought by
Hennick Todd S
Home Financials for this Owner
Home Financials are based on the most recent Mortgage that was taken out on this home.
Original Mortgage
$160,850
Interest Rate
5.06%
Purchase Details
Closed on
Jul 10, 2009
Sold by
Bates Lorraine C
Bought by
Citibank Na Tr
Purchase Details
Closed on
Jun 24, 2005
Sold by
Champagne Kyle
Bought by
Bates Lorraine
Purchase Details
Closed on
Nov 9, 2004
Sold by
Terracciano Gregory and Terracciano Nancee
Bought by
Champagne Kyle
Purchase Details
Closed on
Mar 15, 1991
Sold by
Luzietti Albert and Luzietti Johanna
Bought by
Terracciano Gregory and Terracciano Nancee
Create a Home Valuation Report for This Property
The Home Valuation Report is an in-depth analysis detailing your home's value as well as a comparison with similar homes in the area
Home Values in the Area
Average Home Value in this Area
Purchase History
| Date | Buyer | Sale Price | Title Company |
|---|---|---|---|
| Macgeachie Alan G | -- | -- | |
| Hennick Todd S | $201,000 | -- | |
| Citibank Na Tr | -- | -- | |
| Bates Lorraine | $380,000 | -- | |
| Champagne Kyle | $260,000 | -- | |
| Terracciano Gregory | $141,000 | -- |
Source: Public Records
Mortgage History
| Date | Status | Borrower | Loan Amount |
|---|---|---|---|
| Previous Owner | Terracciano Gregory | $160,850 | |
| Previous Owner | Terracciano Gregory | $489,250 |
Source: Public Records
Tax History Compared to Growth
Tax History
| Year | Tax Paid | Tax Assessment Tax Assessment Total Assessment is a certain percentage of the fair market value that is determined by local assessors to be the total taxable value of land and additions on the property. | Land | Improvement |
|---|---|---|---|---|
| 2025 | $5,088 | $175,980 | $85,575 | $90,405 |
| 2024 | $4,732 | $175,980 | $85,575 | $90,405 |
| 2023 | $4,540 | $175,980 | $46,830 | $129,150 |
| 2022 | $4,391 | $175,980 | $46,830 | $129,150 |
| 2021 | $4,337 | $143,220 | $57,820 | $85,400 |
| 2020 | $4,212 | $143,220 | $57,820 | $85,400 |
| 2019 | $4,077 | $143,220 | $57,820 | $85,400 |
| 2018 | $4,118 | $143,220 | $57,820 | $85,400 |
| 2017 | $4,132 | $143,220 | $57,820 | $85,400 |
| 2016 | $4,149 | $152,740 | $67,270 | $85,470 |
| 2015 | $4,096 | $152,740 | $67,270 | $85,470 |
| 2014 | $3,811 | $152,740 | $67,270 | $85,470 |
Source: Public Records
Map
Nearby Homes
- 88 Eastwood Rd
- 53 Westwood Dr
- 760 Shennecossett Rd
- 26 Bakers Cove Ln
- 895 Shennecossett Rd
- 222 Tyler Ave
- 49 Bayberry Ln
- 90 Jupiter Point Rd
- 520 Shennecossett Rd Unit J
- 119 High Rock Rd
- 42 Godfrey St
- 42 A St
- 63 Johl Dr
- 51 Warner St
- 55 Virginia Ave Unit C
- 172 D St
- 174 D St
- 41 Joe Ave
- 74 Twin Hills Dr
- 597 Pequot Ave
- 33 Chestnut Hill Rd
- 59 Eastwood Rd
- 65 Eastwood Rd
- 39 Chestnut Hill Rd
- 20 Westwood Dr
- 22 Chestnut Hill Rd
- 32 Westwood Dr
- 30 Chestnut Hill Rd
- 81 Eastwood Rd
- 45 Chestnut Hill Rd
- 38 Chestnut Hill Rd
- 42 Westwood Dr
- 48 Pepperidge Ln
- 35 Eastwood Rd
- 46 Chestnut Hill Rd
- 21 Westwood Dr
- 33 Westwood Dr
- 20 Laurel Rd
- 30 Laurel Rd
- 46 Eastwood Rd