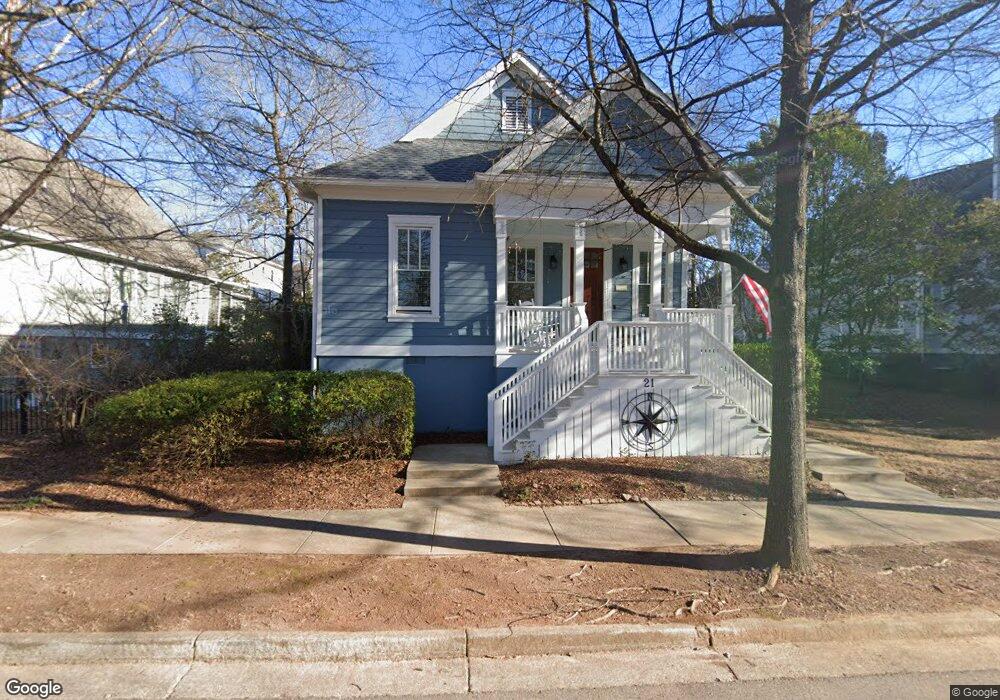
21 Chestnut Oak Run Athens, GA 30607
Estimated Value: $499,110 - $567,000
3
Beds
2
Baths
1,731
Sq Ft
$314/Sq Ft
Est. Value
About This Home
This home is located at 21 Chestnut Oak Run, Athens, GA 30607 and is currently estimated at $543,028, approximately $313 per square foot. 21 Chestnut Oak Run is a home located in Clarke County with nearby schools including Whitehead Road Elementary School, Burney-Harris-Lyons Middle School, and Clarke Central High School.
Ownership History
Date
Name
Owned For
Owner Type
Purchase Details
Closed on
Jun 13, 2017
Sold by
Bishop Matthew L
Bought by
Stevens Harry B
Current Estimated Value
Home Financials for this Owner
Home Financials are based on the most recent Mortgage that was taken out on this home.
Original Mortgage
$221,535
Outstanding Balance
$184,271
Interest Rate
4.02%
Mortgage Type
VA
Estimated Equity
$358,757
Purchase Details
Closed on
Jan 15, 2009
Sold by
Bishop Matthew L
Bought by
Bishop Matthew L
Home Financials for this Owner
Home Financials are based on the most recent Mortgage that was taken out on this home.
Original Mortgage
$279,644
Interest Rate
5.24%
Mortgage Type
FHA
Purchase Details
Closed on
Jan 19, 2007
Sold by
Not Provided
Bought by
Bishop Matthew L and Bishop Natalie F
Purchase Details
Closed on
Nov 19, 2004
Sold by
Oak Grove Development Inc
Bought by
Bishop Matthew L
Create a Home Valuation Report for This Property
The Home Valuation Report is an in-depth analysis detailing your home's value as well as a comparison with similar homes in the area
Home Values in the Area
Average Home Value in this Area
Purchase History
| Date | Buyer | Sale Price | Title Company |
|---|---|---|---|
| Stevens Harry B | $273,500 | -- | |
| Bishop Matthew L | -- | -- | |
| Bishop Matthew L | -- | -- | |
| Bishop Matthew L | $240,000 | -- |
Source: Public Records
Mortgage History
| Date | Status | Borrower | Loan Amount |
|---|---|---|---|
| Open | Stevens Harry B | $221,535 | |
| Previous Owner | Bishop Matthew L | $279,644 |
Source: Public Records
Tax History Compared to Growth
Tax History
| Year | Tax Paid | Tax Assessment Tax Assessment Total Assessment is a certain percentage of the fair market value that is determined by local assessors to be the total taxable value of land and additions on the property. | Land | Improvement |
|---|---|---|---|---|
| 2024 | $3,921 | $185,358 | $24,000 | $161,358 |
| 2023 | $3,953 | $176,694 | $24,000 | $152,694 |
| 2022 | $3,768 | $148,291 | $24,000 | $124,291 |
| 2021 | $3,727 | $130,145 | $20,000 | $110,145 |
| 2020 | $3,681 | $126,808 | $20,000 | $106,808 |
| 2019 | $3,601 | $118,981 | $20,000 | $98,981 |
| 2018 | $3,872 | $114,053 | $20,000 | $94,053 |
| 2017 | $3,453 | $101,698 | $20,000 | $81,698 |
| 2016 | $3,261 | $96,050 | $20,000 | $76,050 |
| 2015 | $3,189 | $93,792 | $20,000 | $73,792 |
| 2014 | $3,094 | $100,848 | $20,000 | $80,848 |
Source: Public Records
Map
Nearby Homes
- 19 Chestnut Oak Run
- 17 Chestnut Oak Run
- 76 Charter Oak Dr
- 25 Chestnut Oak Run
- 22 Chestnut Oak Run
- 72 Charter Oak Dr
- 0 Chestnut Oak Run Unit 7361074
- 27 Chestnut Oak Run
- 68 Charter Oak Dr
- 88 Charter Oak Dr
- 18 Chestnut Oak Run
- 11 Chestnut Oak Run
- 85 Charter Oak Dr
- 87 Charter Oak Dr
- 89 Charter Oak Dr
- 16 Chestnut Oak Run
- 83 Charter Oak Dr
- 81 Charter Oak Dr
- 92 Charter Oak Dr
- 77 Charter Oak Dr