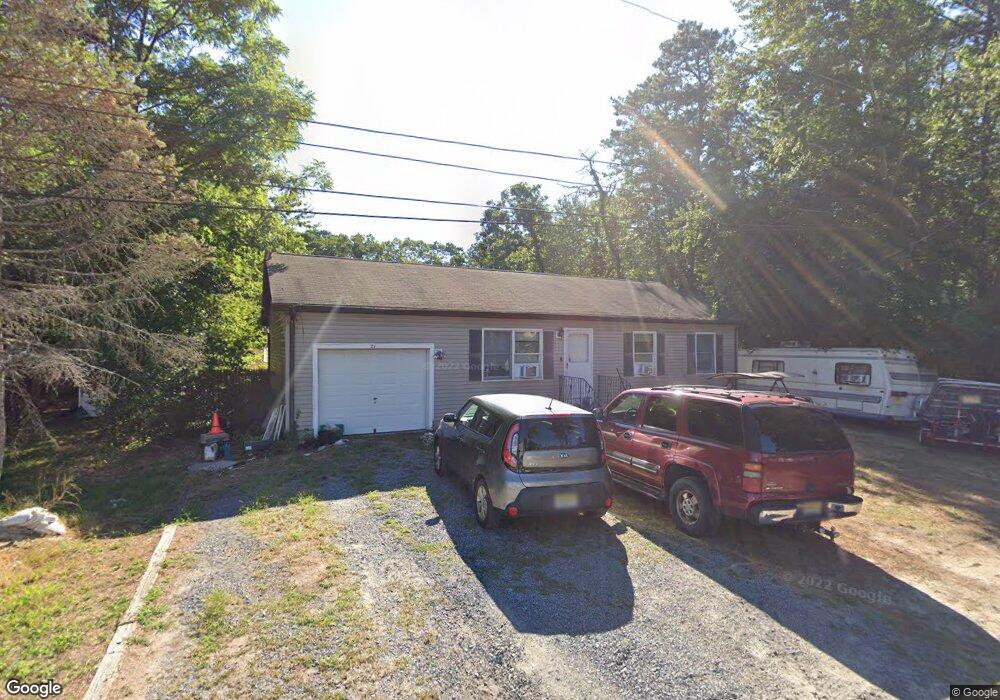
21 Chipmunk Run Browns Mills, NJ 08015
Estimated Value: $294,000 - $321,725
3
Beds
1
Bath
1,400
Sq Ft
$223/Sq Ft
Est. Value
About This Home
This home is located at 21 Chipmunk Run, Browns Mills, NJ 08015 and is currently estimated at $311,681, approximately $222 per square foot. 21 Chipmunk Run is a home located in Burlington County.
Ownership History
Date
Name
Owned For
Owner Type
Purchase Details
Closed on
Dec 30, 2009
Sold by
Bracero Evelyn
Bought by
Livezey James R
Current Estimated Value
Home Financials for this Owner
Home Financials are based on the most recent Mortgage that was taken out on this home.
Original Mortgage
$152,192
Outstanding Balance
$98,699
Interest Rate
4.71%
Mortgage Type
FHA
Estimated Equity
$212,982
Purchase Details
Closed on
May 13, 1998
Sold by
Schultz Mildred and Bracero Evelyn
Bought by
Bracero Evelyn
Create a Home Valuation Report for This Property
The Home Valuation Report is an in-depth analysis detailing your home's value as well as a comparison with similar homes in the area
Home Values in the Area
Average Home Value in this Area
Purchase History
| Date | Buyer | Sale Price | Title Company |
|---|---|---|---|
| Livezey James R | $155,000 | First American Title Ins Co | |
| Bracero Evelyn | -- | -- |
Source: Public Records
Mortgage History
| Date | Status | Borrower | Loan Amount |
|---|---|---|---|
| Open | Livezey James R | $152,192 |
Source: Public Records
Tax History Compared to Growth
Tax History
| Year | Tax Paid | Tax Assessment Tax Assessment Total Assessment is a certain percentage of the fair market value that is determined by local assessors to be the total taxable value of land and additions on the property. | Land | Improvement |
|---|---|---|---|---|
| 2025 | $4,392 | $143,300 | $38,000 | $105,300 |
| 2024 | $4,121 | $143,300 | $38,000 | $105,300 |
| 2023 | $4,121 | $143,300 | $38,000 | $105,300 |
| 2022 | $3,815 | $143,300 | $38,000 | $105,300 |
| 2021 | $3,658 | $143,300 | $38,000 | $105,300 |
| 2020 | $3,521 | $143,300 | $38,000 | $105,300 |
| 2019 | $3,372 | $143,300 | $38,000 | $105,300 |
| 2018 | $3,257 | $143,300 | $38,000 | $105,300 |
| 2017 | $3,190 | $143,300 | $38,000 | $105,300 |
| 2016 | $3,129 | $83,700 | $19,600 | $64,100 |
| 2015 | $3,104 | $83,700 | $19,600 | $64,100 |
| 2014 | $2,967 | $83,700 | $19,600 | $64,100 |
Source: Public Records
Map
Nearby Homes