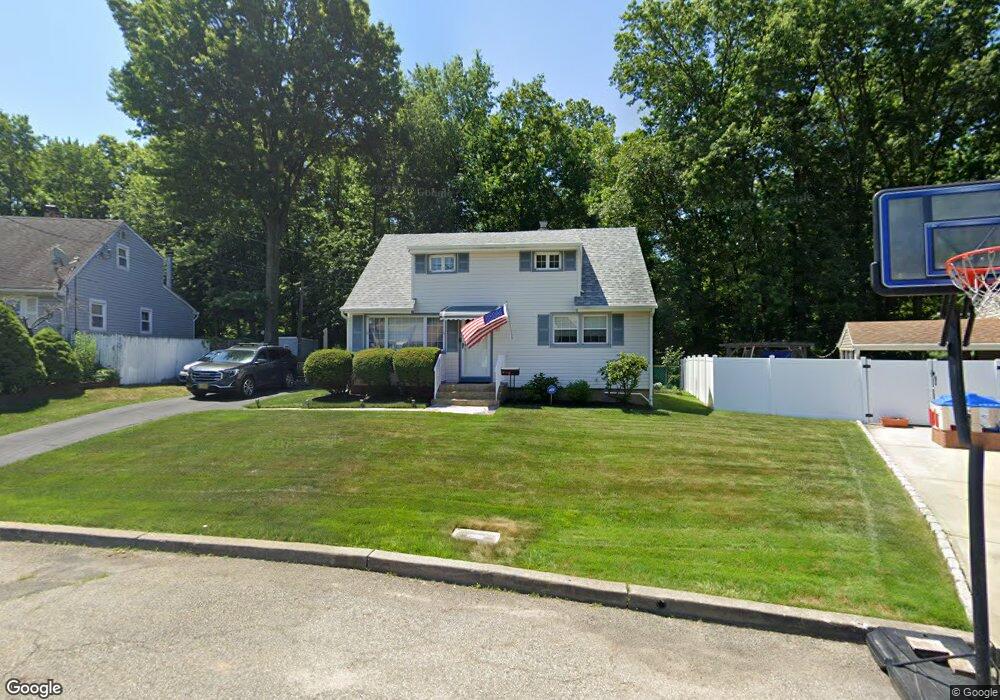
21 Clembil Ct Perth Amboy, NJ 08861
Estimated Value: $281,516 - $455,000
--
Bed
--
Bath
768
Sq Ft
$486/Sq Ft
Est. Value
About This Home
This home is located at 21 Clembil Ct, Perth Amboy, NJ 08861 and is currently estimated at $373,129, approximately $485 per square foot. 21 Clembil Ct is a home located in Middlesex County with nearby schools including Port Reading Elementary School, Fords Middle School, and John F. Kennedy Memorial High School.
Ownership History
Date
Name
Owned For
Owner Type
Purchase Details
Closed on
Apr 11, 2016
Sold by
Varcoe John B and Varcoe Lisette M
Bought by
Bischoff Scott M
Current Estimated Value
Home Financials for this Owner
Home Financials are based on the most recent Mortgage that was taken out on this home.
Original Mortgage
$120,000
Outstanding Balance
$95,426
Interest Rate
3.71%
Mortgage Type
New Conventional
Estimated Equity
$277,703
Purchase Details
Closed on
Sep 29, 1958
Bought by
Varcoe John and Varcoe Lisette M
Create a Home Valuation Report for This Property
The Home Valuation Report is an in-depth analysis detailing your home's value as well as a comparison with similar homes in the area
Home Values in the Area
Average Home Value in this Area
Purchase History
| Date | Buyer | Sale Price | Title Company |
|---|---|---|---|
| Bischoff Scott M | $150,000 | Trident Abstract Title Agenc | |
| Varcoe John | -- | -- |
Source: Public Records
Mortgage History
| Date | Status | Borrower | Loan Amount |
|---|---|---|---|
| Open | Bischoff Scott M | $120,000 |
Source: Public Records
Tax History Compared to Growth
Tax History
| Year | Tax Paid | Tax Assessment Tax Assessment Total Assessment is a certain percentage of the fair market value that is determined by local assessors to be the total taxable value of land and additions on the property. | Land | Improvement |
|---|---|---|---|---|
| 2025 | $6,954 | $54,800 | $22,700 | $32,100 |
| 2024 | $6,779 | $54,800 | $22,700 | $32,100 |
| 2023 | $6,779 | $54,800 | $22,700 | $32,100 |
| 2022 | $6,584 | $54,800 | $22,700 | $32,100 |
| 2021 | $6,581 | $54,800 | $22,700 | $32,100 |
| 2020 | $6,354 | $54,800 | $22,700 | $32,100 |
| 2019 | $6,201 | $54,800 | $22,700 | $32,100 |
| 2018 | $6,061 | $54,800 | $22,700 | $32,100 |
| 2017 | $5,949 | $54,800 | $22,700 | $32,100 |
| 2016 | $5,889 | $54,800 | $22,700 | $32,100 |
| 2015 | $5,533 | $54,800 | $22,700 | $32,100 |
| 2014 | $5,381 | $54,800 | $22,700 | $32,100 |
Source: Public Records
Map
Nearby Homes