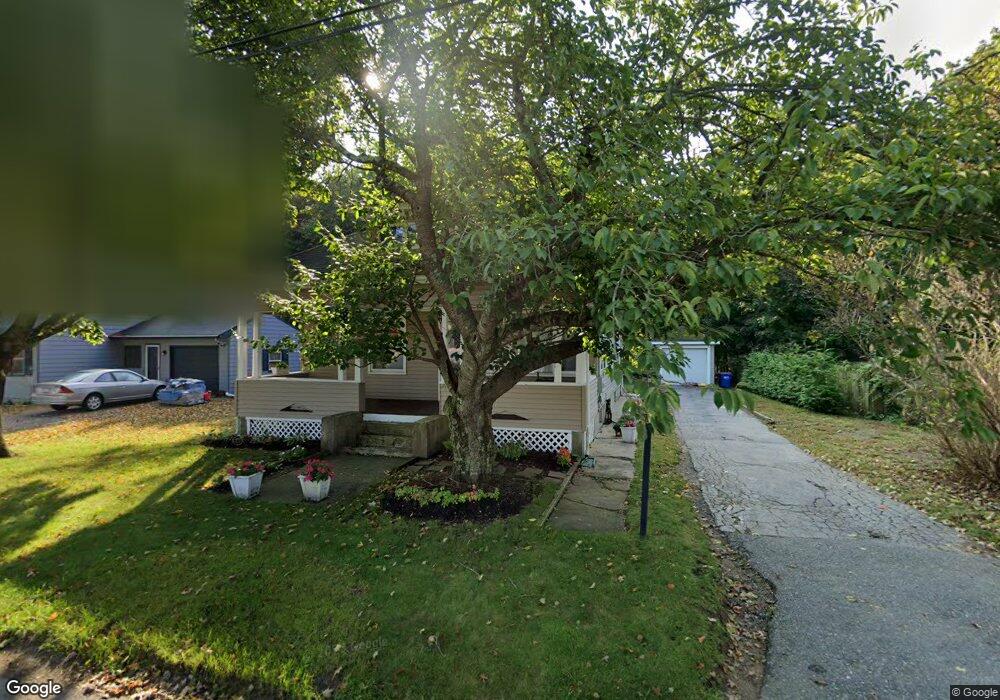
21 Coleman St Seekonk, MA 02771
Estimated Value: $474,686 - $564,000
3
Beds
1
Bath
1,701
Sq Ft
$311/Sq Ft
Est. Value
About This Home
This home is located at 21 Coleman St, Seekonk, MA 02771 and is currently estimated at $529,172, approximately $311 per square foot. 21 Coleman St is a home located in Bristol County with nearby schools including Seekonk High School, St Cecilia School, and Saint Teresa Catholic Elementary School.
Ownership History
Date
Name
Owned For
Owner Type
Purchase Details
Closed on
Mar 26, 2007
Sold by
Arden David W
Bought by
Simas Ryan and Simas Beverly
Current Estimated Value
Home Financials for this Owner
Home Financials are based on the most recent Mortgage that was taken out on this home.
Original Mortgage
$297,500
Outstanding Balance
$181,651
Interest Rate
6.33%
Mortgage Type
Purchase Money Mortgage
Estimated Equity
$347,521
Purchase Details
Closed on
Jun 23, 1998
Sold by
Perkins Nelson I and Perkins Barbara S
Bought by
Arden David W
Home Financials for this Owner
Home Financials are based on the most recent Mortgage that was taken out on this home.
Original Mortgage
$114,950
Interest Rate
7.09%
Mortgage Type
Purchase Money Mortgage
Purchase Details
Closed on
Nov 1, 1988
Sold by
Perkins Gilbert E
Bought by
Perkins Nelson I
Create a Home Valuation Report for This Property
The Home Valuation Report is an in-depth analysis detailing your home's value as well as a comparison with similar homes in the area
Home Values in the Area
Average Home Value in this Area
Purchase History
| Date | Buyer | Sale Price | Title Company |
|---|---|---|---|
| Simas Ryan | $297,500 | -- | |
| Arden David W | $121,000 | -- | |
| Perkins Nelson I | $40,000 | -- |
Source: Public Records
Mortgage History
| Date | Status | Borrower | Loan Amount |
|---|---|---|---|
| Open | Simas Ryan | $297,500 | |
| Previous Owner | Perkins Nelson I | $125,000 | |
| Previous Owner | Perkins Nelson I | $100,000 | |
| Previous Owner | Perkins Nelson I | $114,950 |
Source: Public Records
Tax History
| Year | Tax Paid | Tax Assessment Tax Assessment Total Assessment is a certain percentage of the fair market value that is determined by local assessors to be the total taxable value of land and additions on the property. | Land | Improvement |
|---|---|---|---|---|
| 2025 | $4,914 | $397,900 | $145,300 | $252,600 |
| 2024 | $4,698 | $380,400 | $145,300 | $235,100 |
| 2023 | $4,335 | $330,700 | $123,500 | $207,200 |
| 2022 | $3,947 | $295,900 | $118,300 | $177,600 |
| 2021 | $3,758 | $276,900 | $103,500 | $173,400 |
| 2020 | $3,584 | $272,100 | $103,500 | $168,600 |
| 2019 | $3,312 | $253,600 | $91,200 | $162,400 |
| 2018 | $3,245 | $243,100 | $87,900 | $155,200 |
| 2017 | $3,171 | $235,600 | $87,900 | $147,700 |
| 2016 | $3,139 | $234,100 | $87,900 | $146,200 |
| 2015 | $3,052 | $230,700 | $87,900 | $142,800 |
Source: Public Records
Map
Nearby Homes