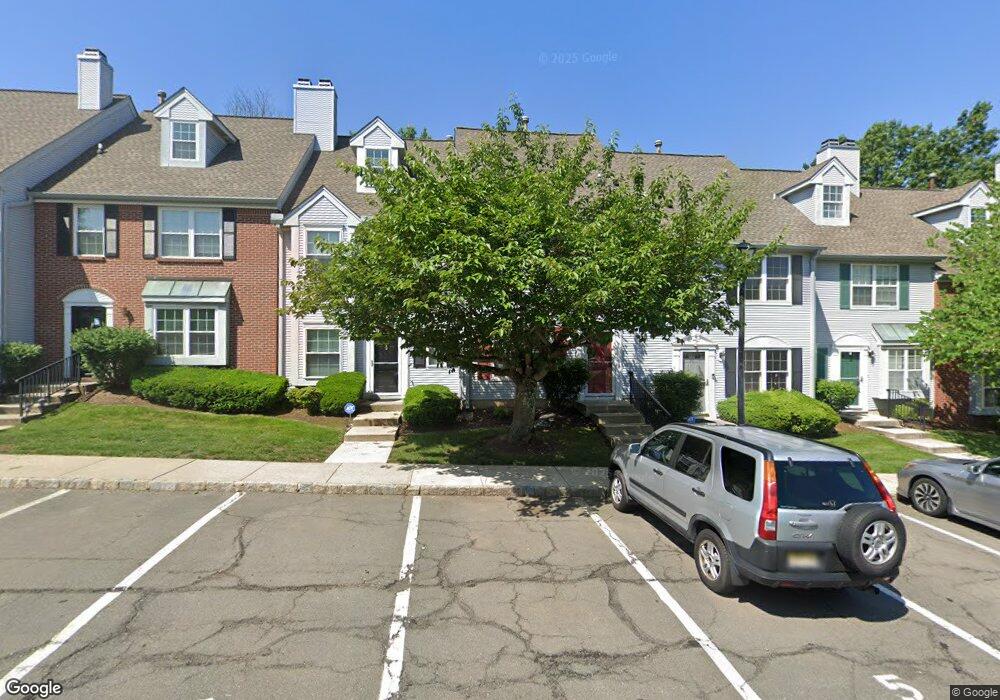
21 Colleen Ct Kendall Park, NJ 08824
Estimated Value: $480,000 - $531,000
2
Beds
3
Baths
--
Sq Ft
871
Sq Ft Lot
About This Home
This home is located at 21 Colleen Ct, Kendall Park, NJ 08824 and is currently estimated at $502,850. 21 Colleen Ct is a home located in Middlesex County with nearby schools including Brunswick Acres Elementary School, Crossroads South Middle School, and South Brunswick High School.
Ownership History
Date
Name
Owned For
Owner Type
Purchase Details
Closed on
Jul 15, 2019
Sold by
Garter Cindy
Bought by
Kanakaraj Ikandaswamy
Current Estimated Value
Home Financials for this Owner
Home Financials are based on the most recent Mortgage that was taken out on this home.
Original Mortgage
$255,550
Outstanding Balance
$167,775
Interest Rate
3.82%
Mortgage Type
New Conventional
Estimated Equity
$335,075
Purchase Details
Closed on
Aug 4, 1992
Bought by
Garter Cindy
Create a Home Valuation Report for This Property
The Home Valuation Report is an in-depth analysis detailing your home's value as well as a comparison with similar homes in the area
Home Values in the Area
Average Home Value in this Area
Purchase History
| Date | Buyer | Sale Price | Title Company |
|---|---|---|---|
| Kanakaraj Ikandaswamy | $269,000 | Stewart Title Guaranty Co | |
| Garter Cindy | $104,900 | -- |
Source: Public Records
Mortgage History
| Date | Status | Borrower | Loan Amount |
|---|---|---|---|
| Open | Kanakaraj Ikandaswamy | $255,550 |
Source: Public Records
Tax History Compared to Growth
Tax History
| Year | Tax Paid | Tax Assessment Tax Assessment Total Assessment is a certain percentage of the fair market value that is determined by local assessors to be the total taxable value of land and additions on the property. | Land | Improvement |
|---|---|---|---|---|
| 2025 | $6,089 | $111,800 | $50,000 | $61,800 |
| 2024 | $5,870 | $111,800 | $50,000 | $61,800 |
| 2023 | $5,870 | $111,800 | $50,000 | $61,800 |
| 2022 | $5,697 | $111,800 | $50,000 | $61,800 |
| 2021 | $4,382 | $111,800 | $50,000 | $61,800 |
| 2020 | $5,729 | $111,800 | $50,000 | $61,800 |
| 2019 | $5,779 | $111,800 | $50,000 | $61,800 |
| 2018 | $5,590 | $111,800 | $50,000 | $61,800 |
| 2017 | $5,581 | $111,800 | $50,000 | $61,800 |
| 2016 | $5,522 | $111,800 | $50,000 | $61,800 |
| 2015 | $5,354 | $111,800 | $50,000 | $61,800 |
| 2014 | $5,268 | $111,800 | $50,000 | $61,800 |
Source: Public Records
Map
Nearby Homes