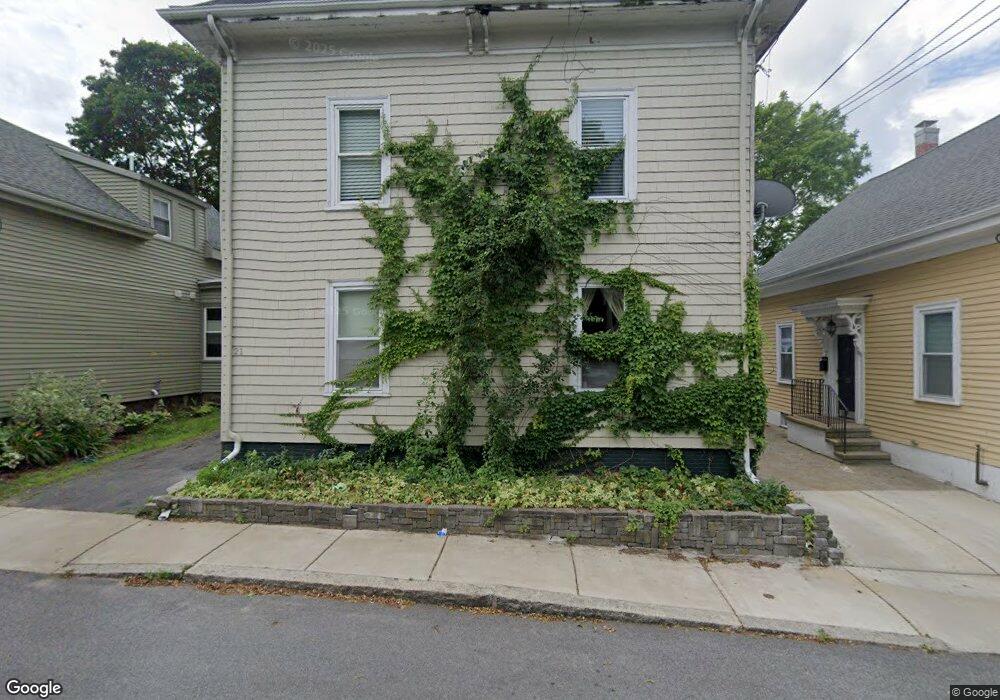
21 Conant St Salem, MA 01970
Bridge Street NeighborhoodEstimated Value: $875,792 - $1,043,000
6
Beds
3
Baths
3,381
Sq Ft
$281/Sq Ft
Est. Value
About This Home
This home is located at 21 Conant St, Salem, MA 01970 and is currently estimated at $950,448, approximately $281 per square foot. 21 Conant St is a home located in Essex County with nearby schools including Carlton Elementary School, Saltonstall School, and Bates Elementary School.
Ownership History
Date
Name
Owned For
Owner Type
Purchase Details
Closed on
Jan 29, 2019
Sold by
Bennett Chad
Bought by
Bennett Chad
Current Estimated Value
Purchase Details
Closed on
Jan 2, 2004
Sold by
Cross-Losee Elizabeth
Bought by
Bennett Chad and King Barbara
Home Financials for this Owner
Home Financials are based on the most recent Mortgage that was taken out on this home.
Original Mortgage
$330,400
Interest Rate
5.86%
Mortgage Type
Purchase Money Mortgage
Purchase Details
Closed on
Jan 31, 2000
Sold by
Burgos Francisco and Burgos Celia I
Bought by
Cross-Losee Elizabeth
Home Financials for this Owner
Home Financials are based on the most recent Mortgage that was taken out on this home.
Original Mortgage
$198,000
Interest Rate
7.83%
Mortgage Type
Purchase Money Mortgage
Purchase Details
Closed on
Apr 24, 1995
Sold by
Kluska Monica Est and Pettoruto
Bought by
Burgos Francisco and Burgos Celia
Create a Home Valuation Report for This Property
The Home Valuation Report is an in-depth analysis detailing your home's value as well as a comparison with similar homes in the area
Home Values in the Area
Average Home Value in this Area
Purchase History
| Date | Buyer | Sale Price | Title Company |
|---|---|---|---|
| Bennett Chad | -- | -- | |
| Bennett Chad | $413,000 | -- | |
| Cross-Losee Elizabeth | $220,000 | -- | |
| Burgos Francisco | $125,000 | -- |
Source: Public Records
Mortgage History
| Date | Status | Borrower | Loan Amount |
|---|---|---|---|
| Previous Owner | Burgos Francisco | $330,400 | |
| Previous Owner | Burgos Francisco | $244,000 | |
| Previous Owner | Burgos Francisco | $39,500 | |
| Previous Owner | Burgos Francisco | $198,000 |
Source: Public Records
Tax History
| Year | Tax Paid | Tax Assessment Tax Assessment Total Assessment is a certain percentage of the fair market value that is determined by local assessors to be the total taxable value of land and additions on the property. | Land | Improvement |
|---|---|---|---|---|
| 2025 | $8,685 | $765,900 | $167,600 | $598,300 |
| 2024 | $7,984 | $687,100 | $158,800 | $528,300 |
| 2023 | $7,726 | $617,600 | $147,000 | $470,600 |
| 2022 | $7,653 | $577,600 | $138,200 | $439,400 |
| 2021 | $7,453 | $540,100 | $138,200 | $401,900 |
| 2020 | $6,904 | $477,800 | $119,400 | $358,400 |
| 2019 | $6,842 | $453,100 | $113,500 | $339,600 |
| 2018 | $6,312 | $410,400 | $108,200 | $302,200 |
| 2017 | $5,895 | $371,700 | $88,200 | $283,500 |
| 2016 | $5,751 | $367,000 | $83,500 | $283,500 |
| 2015 | $5,586 | $340,400 | $75,300 | $265,100 |
Source: Public Records
Map
Nearby Homes
- 16 Williams St
- 31 N Washington Square Unit 3
- 11 Williams St Unit 2
- 21 Emerton St Unit 2
- 17 Orchard St
- 41 Dearborn St
- 16 Franklin St Unit 2403
- 16 Franklin St Unit 1303
- 16 Franklin St Unit 2202
- 7 Forrester St
- 40 Essex St Unit 2
- 17 Webb St Unit 1
- 69 Essex St Unit 2
- 8 Webb St
- 21 Manning St
- 7 Curtis St Unit 1
- 65 Washington St Unit 512
- 112 North St
- 11 Church St Unit 203
- 11 Church St Unit 702
Your Personal Tour Guide
Ask me questions while you tour the home.