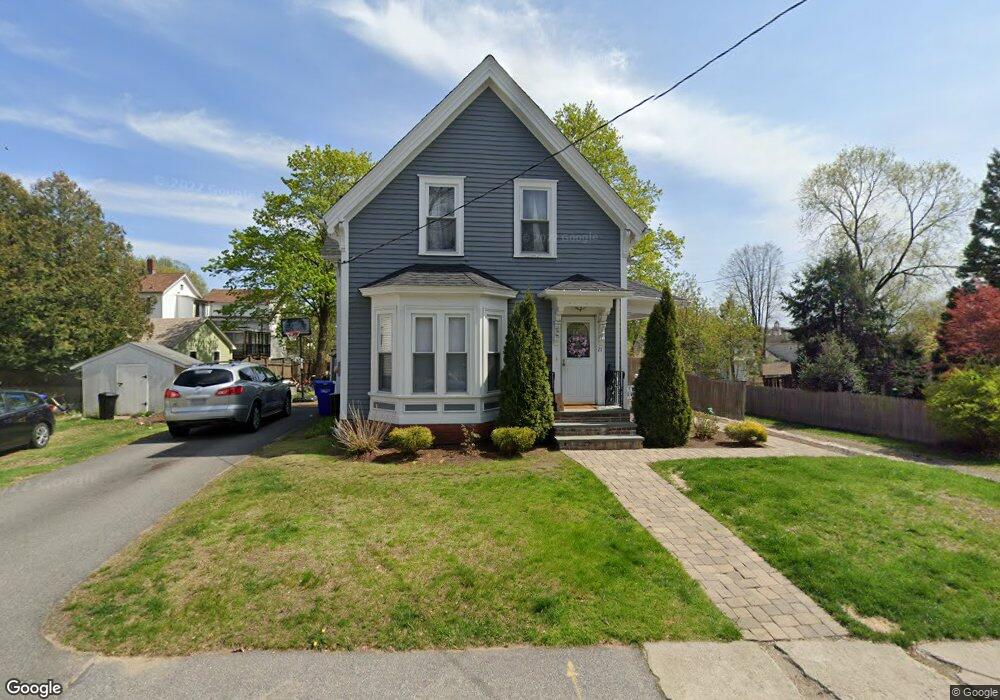
21 Concord St Maynard, MA 01754
Maynard AreaEstimated Value: $681,000 - $773,000
About This Home
This home is located at 21 Concord St, Maynard, MA 01754 and is currently estimated at $717,745, approximately $361 per square foot. 21 Concord St is a home located in Middlesex County with nearby schools including Green Meadow School, Fowler School, and Maynard High School.
Ownership History
We collect this data history from publicly available records. To have your information removed, we recommend requesting removal directly through your county’s website.
Purchase Details
Purchase Details
Home Values in the Area
Average Home Value in this Area
Purchase History
We collect this data history from publicly available records. To have your information removed, we recommend requesting removal directly through your county’s website.
| Date | Buyer | Sale Price | Title Company |
|---|---|---|---|
| -- | -- | ||
| $148,000 | -- |
Mortgage History
We collect this data history from publicly available records. To have your information removed, we recommend requesting removal directly through your county’s website.
| Date | Status | Borrower | Loan Amount |
|---|---|---|---|
| Previous Owner | $262,500 | ||
| Previous Owner | $263,000 |
Tax History
We collect this data history from publicly available records. To have your information removed, we recommend requesting removal directly through your county’s website.
| Year | Tax Paid | Tax Assessment Tax Assessment Total Assessment is a certain percentage of the fair market value that is determined by local assessors to be the total taxable value of land and additions on the property. | Land | Improvement |
|---|---|---|---|---|
| 2025 | $9,493 | $532,400 | $269,400 | $263,000 |
| 2024 | $8,856 | $495,300 | $256,600 | $238,700 |
| 2023 | $8,812 | $464,500 | $244,400 | $220,100 |
| 2022 | $8,729 | $425,400 | $205,300 | $220,100 |
| 2021 | $8,517 | $422,700 | $205,300 | $217,400 |
| 2020 | $8,320 | $403,100 | $185,700 | $217,400 |
| 2019 | $7,930 | $376,900 | $177,400 | $199,500 |
| 2018 | $7,385 | $326,200 | $161,300 | $164,900 |
| 2017 | $7,404 | $336,400 | $161,300 | $175,100 |
| 2016 | $7,149 | $336,400 | $161,300 | $175,100 |
| 2015 | $6,713 | $300,900 | $153,900 | $147,000 |
| 2014 | $6,600 | $296,100 | $149,100 | $147,000 |
Map
- 10 Concord St
- 151 Main St
- 16 Hillside St Unit 1
- 16 Hillside St Unit 2
- 127 Summer St
- 2 Dartmouth Ct Unit 2
- 26 Powder Mill Rd
- 12 Howard Rd
- 25 Mockingbird Ln
- 22 Douglas Ave Unit 2
- 190-192 Main St
- 40 Fairfield St
- 70 Powder Mill Rd
- 15 Dana Rd
- 59 Waltham St
- 5 Sunset Rd
- 62 Waltham St
- 5 Deer Path Unit 2
- 89 Powder Mill Rd
- 5 Main St
Ask me questions while you tour the home.