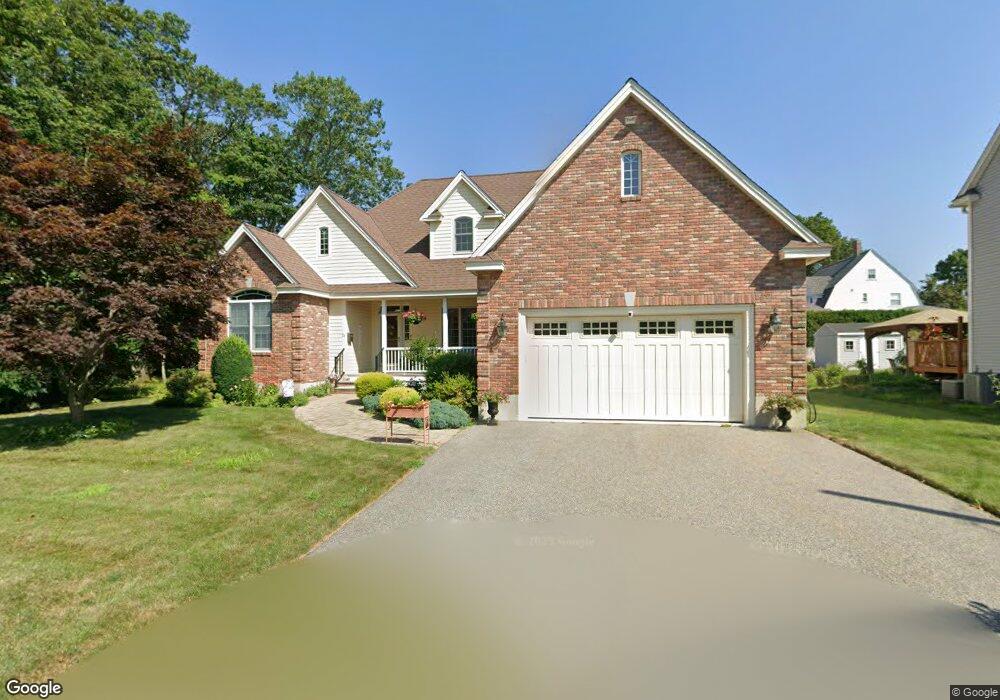
21 Conoyle St Lowell, MA 01851
Highlands NeighborhoodEstimated Value: $738,000 - $937,000
3
Beds
3
Baths
2,172
Sq Ft
$389/Sq Ft
Est. Value
About This Home
This home is located at 21 Conoyle St, Lowell, MA 01851 and is currently estimated at $845,604, approximately $389 per square foot. 21 Conoyle St is a home located in Middlesex County with nearby schools including Charles W. Morey Elementary School, Dr. Gertrude Bailey Elementary School, and Abraham Lincoln Elementary School.
Ownership History
Date
Name
Owned For
Owner Type
Purchase Details
Closed on
Jan 10, 2023
Sold by
Finneral Delia F
Bought by
Delia L Finneral 2023 Lt and Finneral
Current Estimated Value
Purchase Details
Closed on
Jun 2, 2006
Sold by
Whiskers Rt and Tye
Bought by
Finneral Delia F
Create a Home Valuation Report for This Property
The Home Valuation Report is an in-depth analysis detailing your home's value as well as a comparison with similar homes in the area
Home Values in the Area
Average Home Value in this Area
Purchase History
| Date | Buyer | Sale Price | Title Company |
|---|---|---|---|
| Delia L Finneral 2023 Lt | -- | None Available | |
| Delia L Finneral 2023 Lt | -- | None Available | |
| Finneral Delia F | $175,000 | -- | |
| Finneral Delia F | $175,000 | -- |
Source: Public Records
Tax History
| Year | Tax Paid | Tax Assessment Tax Assessment Total Assessment is a certain percentage of the fair market value that is determined by local assessors to be the total taxable value of land and additions on the property. | Land | Improvement |
|---|---|---|---|---|
| 2025 | $9,960 | $867,600 | $219,000 | $648,600 |
| 2024 | $9,430 | $791,800 | $187,600 | $604,200 |
| 2023 | $9,295 | $748,400 | $163,200 | $585,200 |
| 2022 | $8,773 | $691,300 | $148,300 | $543,000 |
| 2021 | $8,155 | $605,900 | $129,000 | $476,900 |
| 2020 | $7,678 | $574,700 | $114,900 | $459,800 |
| 2019 | $8,074 | $575,100 | $115,100 | $460,000 |
| 2018 | $8,163 | $567,300 | $109,600 | $457,700 |
| 2017 | $7,623 | $510,900 | $99,700 | $411,200 |
| 2016 | $7,750 | $511,200 | $103,000 | $408,200 |
| 2015 | $7,460 | $481,900 | $99,400 | $382,500 |
| 2013 | $6,298 | $419,600 | $115,200 | $304,400 |
Source: Public Records
Map
Nearby Homes
- 142 Sanders Ave
- 694 Westford St
- 977 Westford St Unit 4
- 137 Pine St Unit 11
- 45 Harvard St Unit 5 3rd fl
- 11 Warwick St Unit 3
- 94 D St
- 4 Tamarack St
- 85 B St
- 1311 Middlesex St
- 138 W Forest St
- 312 Wilder St
- 108 Inland St
- 18 Burgess St
- 49 Marginal St
- 186 Powell St
- 525 Chelmsford St
- 3 Butman Place
- 19 Lawton St
- 295 Pawtucket Blvd Unit 7
Your Personal Tour Guide
Ask me questions while you tour the home.