21 Cornell Rd New Fairfield, CT 06812
Estimated Value: $738,000 - $766,000
4
Beds
4
Baths
2,772
Sq Ft
$273/Sq Ft
Est. Value
About This Home
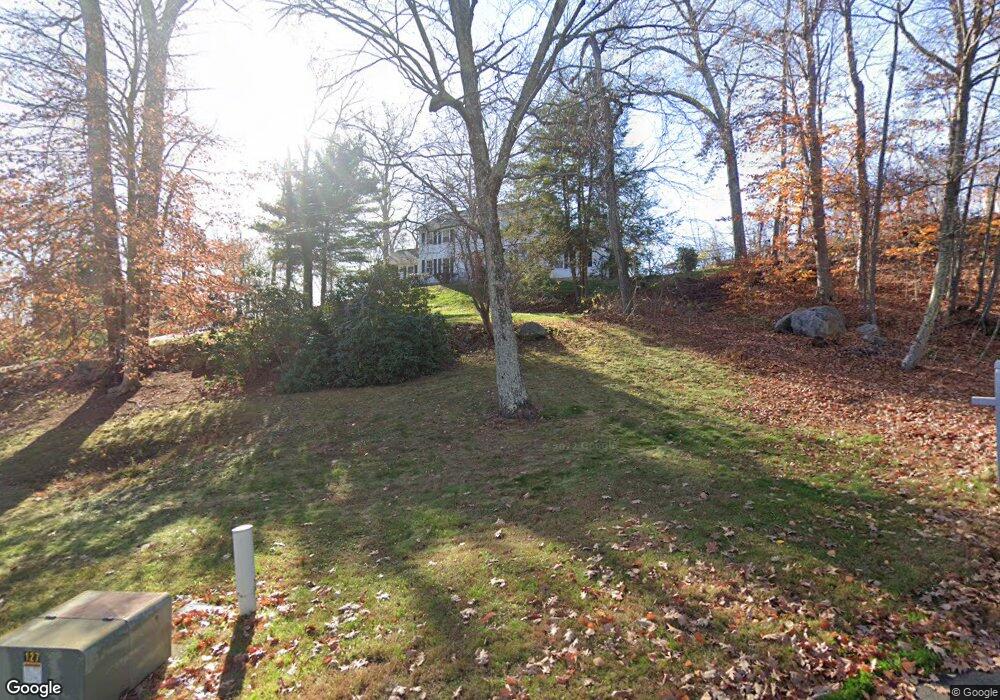
This home is located at 21 Cornell Rd, New Fairfield, CT 06812 and is currently estimated at $757,142, approximately $273 per square foot. 21 Cornell Rd is a home located in Fairfield County with nearby schools including Meeting House Hill School, New Fairfield Middle School, and New Fairfield High School.
Ownership History
Date
Name
Owned For
Owner Type
Purchase Details
Closed on
Jun 2, 2020
Sold by
Quinn Christopher and Quinn Melissa
Bought by
Mele Kelly and Mele Vincent
Current Estimated Value
Home Financials for this Owner
Home Financials are based on the most recent Mortgage that was taken out on this home.
Original Mortgage
$432,630
Outstanding Balance
$383,493
Interest Rate
3.2%
Mortgage Type
Purchase Money Mortgage
Estimated Equity
$373,649
Purchase Details
Closed on
Dec 23, 2008
Sold by
Braverman Leonard W and Braverman Bonni E
Bought by
Quinn Melissa Kay and Quinn Christopher
Purchase Details
Closed on
Oct 4, 1994
Sold by
Voris John and Voris Joan
Bought by
Braveman Leonard and Braveman Rita
Create a Home Valuation Report for This Property
The Home Valuation Report is an in-depth analysis detailing your home's value as well as a comparison with similar homes in the area
Home Values in the Area
Average Home Value in this Area
Purchase History
| Date | Buyer | Sale Price | Title Company |
|---|---|---|---|
| Mele Kelly | $480,700 | None Available | |
| Quinn Melissa Kay | $545,000 | -- | |
| Braveman Leonard | $337,000 | -- |
Source: Public Records
Mortgage History
| Date | Status | Borrower | Loan Amount |
|---|---|---|---|
| Open | Mele Kelly | $432,630 | |
| Previous Owner | Braveman Leonard | $466,000 | |
| Previous Owner | Braveman Leonard | $466,000 |
Source: Public Records
Tax History
| Year | Tax Paid | Tax Assessment Tax Assessment Total Assessment is a certain percentage of the fair market value that is determined by local assessors to be the total taxable value of land and additions on the property. | Land | Improvement |
|---|---|---|---|---|
| 2025 | $11,188 | $424,900 | $138,000 | $286,900 |
| 2024 | $10,832 | $296,600 | $125,400 | $171,200 |
| 2023 | $10,351 | $296,600 | $125,400 | $171,200 |
| 2022 | $9,631 | $296,600 | $125,400 | $171,200 |
| 2021 | $9,340 | $296,600 | $125,400 | $171,200 |
| 2020 | $9,070 | $296,600 | $125,400 | $171,200 |
| 2019 | $8,813 | $285,200 | $132,200 | $153,000 |
| 2018 | $8,721 | $285,200 | $132,200 | $153,000 |
| 2017 | $8,505 | $285,200 | $132,200 | $153,000 |
| 2016 | $8,180 | $285,200 | $132,200 | $153,000 |
| 2015 | $8,180 | $285,200 | $132,200 | $153,000 |
| 2014 | $8,672 | $332,500 | $142,900 | $189,600 |
Source: Public Records
Map
Nearby Homes
Your Personal Tour Guide
Ask me questions while you tour the home.