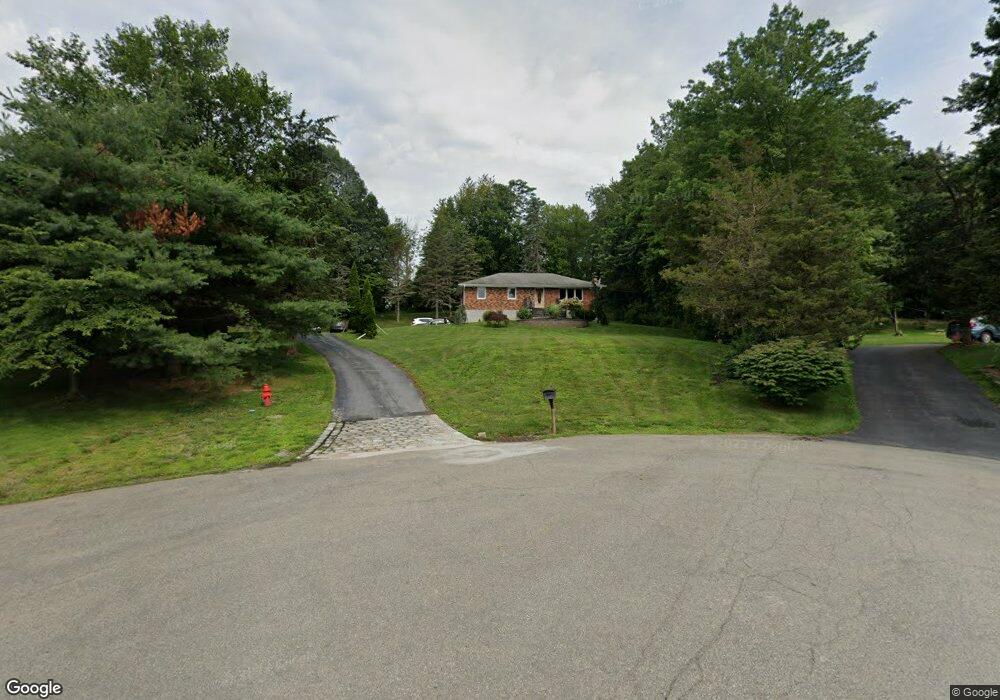
21 Crest Ct Hopewell Junction, NY 12533
Estimated Value: $411,000 - $440,000
3
Beds
1
Bath
1,269
Sq Ft
$334/Sq Ft
Est. Value
About This Home
This home is located at 21 Crest Ct, Hopewell Junction, NY 12533 and is currently estimated at $423,591, approximately $333 per square foot. 21 Crest Ct is a home located in Dutchess County with nearby schools including Myers Corners Elementary School, Van Wyck Junior High School, and John Jay Senior High School.
Ownership History
Date
Name
Owned For
Owner Type
Purchase Details
Closed on
Jul 13, 2005
Sold by
Mazzullo Michael J
Bought by
Berisha Shaban
Current Estimated Value
Home Financials for this Owner
Home Financials are based on the most recent Mortgage that was taken out on this home.
Original Mortgage
$200,000
Interest Rate
5.67%
Mortgage Type
Purchase Money Mortgage
Purchase Details
Closed on
Aug 15, 1994
Sold by
Matzko Gustave
Bought by
Mazzullo Michael J
Create a Home Valuation Report for This Property
The Home Valuation Report is an in-depth analysis detailing your home's value as well as a comparison with similar homes in the area
Home Values in the Area
Average Home Value in this Area
Purchase History
| Date | Buyer | Sale Price | Title Company |
|---|---|---|---|
| Berisha Shaban | $315,000 | Richard Schisano | |
| Mazzullo Michael J | $129,900 | -- |
Source: Public Records
Mortgage History
| Date | Status | Borrower | Loan Amount |
|---|---|---|---|
| Closed | Berisha Shaban | $200,000 |
Source: Public Records
Tax History Compared to Growth
Tax History
| Year | Tax Paid | Tax Assessment Tax Assessment Total Assessment is a certain percentage of the fair market value that is determined by local assessors to be the total taxable value of land and additions on the property. | Land | Improvement |
|---|---|---|---|---|
| 2024 | $8,325 | $334,100 | $67,500 | $266,600 |
| 2023 | $8,325 | $315,000 | $67,500 | $247,500 |
| 2022 | $8,201 | $286,400 | $67,500 | $218,900 |
| 2021 | $7,519 | $255,700 | $67,500 | $188,200 |
| 2020 | $5,882 | $236,800 | $67,500 | $169,300 |
| 2019 | $5,683 | $236,800 | $67,500 | $169,300 |
| 2018 | $5,495 | $223,400 | $67,500 | $155,900 |
| 2017 | $5,441 | $221,200 | $67,500 | $153,700 |
| 2016 | $9,379 | $221,200 | $67,500 | $153,700 |
| 2015 | -- | $221,200 | $67,500 | $153,700 |
| 2014 | -- | $221,200 | $67,500 | $153,700 |
Source: Public Records
Map
Nearby Homes