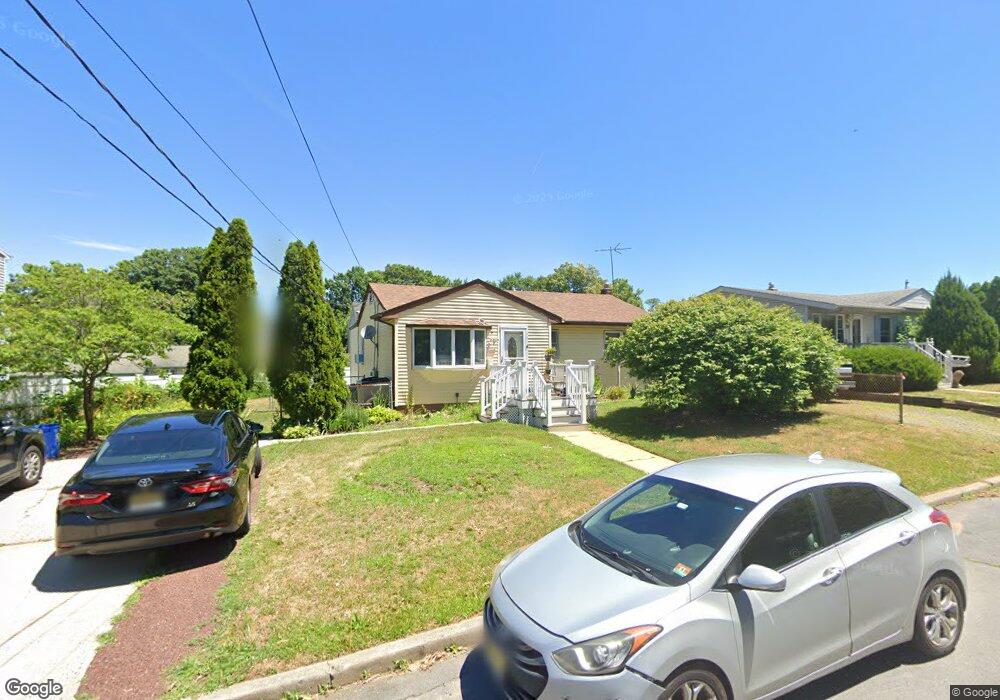
21 Cross Ave Matawan, NJ 07747
Estimated Value: $373,000 - $536,000
3
Beds
2
Baths
1,124
Sq Ft
$417/Sq Ft
Est. Value
About This Home
This home is located at 21 Cross Ave, Matawan, NJ 07747 and is currently estimated at $468,903, approximately $417 per square foot. 21 Cross Ave is a home located in Monmouth County with nearby schools including Matawan Reg High School, St. Joseph Elementary School, and Icob Academy.
Ownership History
Date
Name
Owned For
Owner Type
Purchase Details
Closed on
Aug 4, 1995
Sold by
Ruppell Joseph
Bought by
Clark Mary
Current Estimated Value
Home Financials for this Owner
Home Financials are based on the most recent Mortgage that was taken out on this home.
Original Mortgage
$92,000
Interest Rate
7.32%
Create a Home Valuation Report for This Property
The Home Valuation Report is an in-depth analysis detailing your home's value as well as a comparison with similar homes in the area
Home Values in the Area
Average Home Value in this Area
Purchase History
| Date | Buyer | Sale Price | Title Company |
|---|---|---|---|
| Clark Mary | $102,000 | -- |
Source: Public Records
Mortgage History
| Date | Status | Borrower | Loan Amount |
|---|---|---|---|
| Closed | Clark Mary | $92,000 |
Source: Public Records
Tax History
| Year | Tax Paid | Tax Assessment Tax Assessment Total Assessment is a certain percentage of the fair market value that is determined by local assessors to be the total taxable value of land and additions on the property. | Land | Improvement |
|---|---|---|---|---|
| 2025 | $8,828 | $478,300 | $353,000 | $125,300 |
| 2024 | $7,476 | $436,800 | $313,800 | $123,000 |
| 2023 | $7,476 | $349,500 | $229,400 | $120,100 |
| 2022 | $6,453 | $306,300 | $191,900 | $114,400 |
| 2021 | $6,453 | $250,100 | $148,400 | $101,700 |
| 2020 | $6,535 | $240,800 | $141,400 | $99,400 |
| 2019 | $7,125 | $255,000 | $146,400 | $108,600 |
| 2018 | $7,171 | $257,300 | $141,400 | $115,900 |
| 2017 | $6,837 | $248,800 | $136,400 | $112,400 |
| 2016 | $6,396 | $242,900 | $133,400 | $109,500 |
| 2015 | $6,449 | $235,100 | $128,400 | $106,700 |
| 2014 | $6,171 | $229,400 | $123,400 | $106,000 |
Source: Public Records
Map
Nearby Homes
- 55 Lower Main St
- 284 Washington St
- 154 Lower Main St
- 207 Lower Main St
- 52 Highway 35
- 3 Harrison Ave
- 253 Broadway
- 155 Luppatatong Ave
- 369 Riverdale Dr
- 10 Johnson Ave
- 227 W Prospect Ave
- 95 Broadway
- 49 Lucia Ct
- 2 Chingarora Ave
- 68 Main St
- 46 Parkview Dr
- 3 Noble Place
- 5 Barrier Dr
- 13 Cresci Blvd
- 81 Village Green Way
- 25 Cross Ave
- 19 Cross Ave
- 10 Oakshades Ave
- 12 Cross Ave Unit C
- 8 Oakshades Ave
- 18 Cross Ave
- 18 Cross Ave
- 27 Cross Ave
- 10 Cross Ave
- 6 Oakshades Ave
- 7 Cross Ave
- 29 Cross Ave
- 25 Oakshades Ave
- 13 Washington Ave
- 8 Cross Ave Unit C
- 11 Washington Ave
- 4 Oakshades Ave
- 15 Washington Ave
- 5 Cross Ave
- 19 Oakshades Ave
Your Personal Tour Guide
Ask me questions while you tour the home.