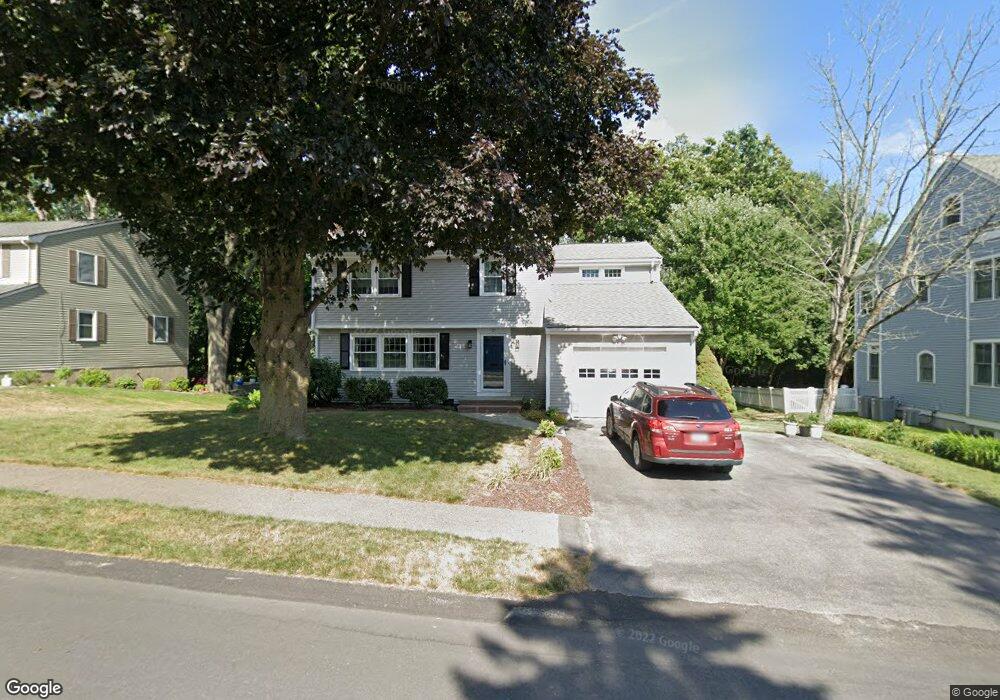
21 Cynthia Rd Needham Heights, MA 02494
Estimated Value: $1,228,000 - $1,573,000
3
Beds
2
Baths
952
Sq Ft
$1,457/Sq Ft
Est. Value
About This Home
This home is located at 21 Cynthia Rd, Needham Heights, MA 02494 and is currently estimated at $1,387,247, approximately $1,457 per square foot. 21 Cynthia Rd is a home located in Norfolk County with nearby schools including Sunita L. Williams Elementary School, High Rock Middle School, and Pollard Middle School.
Ownership History
Date
Name
Owned For
Owner Type
Purchase Details
Closed on
Feb 10, 2021
Sold by
Marinelli Kevin A and Marinelli Martieanne
Bought by
Kevin A Marinelli T A and Kevin Marinelli
Current Estimated Value
Purchase Details
Closed on
Dec 1, 1997
Sold by
Winston Kenneth J and Winston Ellen M
Bought by
Marinelli Kevin A and Marinelli Martienne
Purchase Details
Closed on
Jun 5, 1992
Sold by
Goldberg Marvin E and Goldbert Shirley E
Bought by
Winston Kenneth J and Winston Ellen M
Create a Home Valuation Report for This Property
The Home Valuation Report is an in-depth analysis detailing your home's value as well as a comparison with similar homes in the area
Home Values in the Area
Average Home Value in this Area
Purchase History
| Date | Buyer | Sale Price | Title Company |
|---|---|---|---|
| Kevin A Marinelli T A | -- | None Available | |
| Kevin A Marinelli T | -- | None Available | |
| Marinelli Kevin A | $355,000 | -- | |
| Marinelli Kevin A | $355,000 | -- | |
| Winston Kenneth J | $261,650 | -- | |
| Winston Kenneth J | $261,650 | -- |
Source: Public Records
Mortgage History
| Date | Status | Borrower | Loan Amount |
|---|---|---|---|
| Previous Owner | Winston Kenneth J | $200,000 | |
| Previous Owner | Winston Kenneth J | $313,000 |
Source: Public Records
Tax History Compared to Growth
Tax History
| Year | Tax Paid | Tax Assessment Tax Assessment Total Assessment is a certain percentage of the fair market value that is determined by local assessors to be the total taxable value of land and additions on the property. | Land | Improvement |
|---|---|---|---|---|
| 2025 | $12,311 | $1,161,400 | $766,600 | $394,800 |
| 2024 | $10,304 | $823,000 | $457,900 | $365,100 |
| 2023 | $10,337 | $792,700 | $457,900 | $334,800 |
| 2022 | $9,890 | $739,700 | $414,100 | $325,600 |
| 2021 | $9,638 | $739,700 | $414,100 | $325,600 |
| 2020 | $9,270 | $742,200 | $414,100 | $328,100 |
| 2019 | $8,706 | $702,700 | $377,900 | $324,800 |
| 2018 | $8,348 | $702,700 | $377,900 | $324,800 |
| 2017 | $7,887 | $663,300 | $377,900 | $285,400 |
| 2016 | $7,654 | $663,300 | $377,900 | $285,400 |
| 2015 | $7,489 | $663,300 | $377,900 | $285,400 |
| 2014 | $7,276 | $625,100 | $344,900 | $280,200 |
Source: Public Records
Map
Nearby Homes
- 35 Andrea Cir
- 263 Hunnewell St
- 379 Hunnewell St Unit 379
- 381 Hunnewell St Unit 381
- 98 Hunnewell St
- 443 Central Ave
- 403 Hunnewell St Unit 403
- 400 Hunnewell St Unit 103
- 132 Hillside Ave
- 7 Avery St
- 71 Brookside Rd
- 445 Hillside Ave
- 14 Hunnewell St
- 345 Central Ave
- 78 Hunnewell St
- 28 Mercer Rd
- 609 Hunnewell St
- 310 Oakland St
- 36 Davenport Rd
- 77 High St