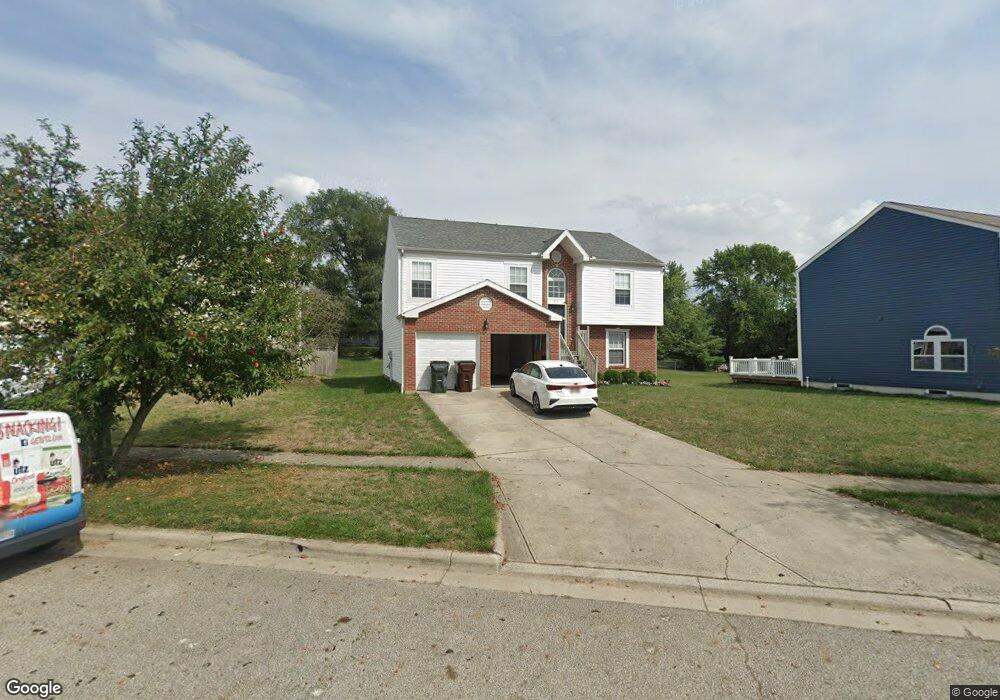
21 Danielson Cir South Bloomfield, OH 43103
Estimated Value: $304,030 - $337,000
4
Beds
3
Baths
2,154
Sq Ft
$149/Sq Ft
Est. Value
About This Home
This home is located at 21 Danielson Cir, South Bloomfield, OH 43103 and is currently estimated at $320,508, approximately $148 per square foot. 21 Danielson Cir is a home located in Pickaway County.
Ownership History
Date
Name
Owned For
Owner Type
Purchase Details
Closed on
Jan 17, 2020
Sold by
Moore Arlene M
Bought by
Johnson Amber L and Johnson Amber L
Current Estimated Value
Purchase Details
Closed on
Dec 21, 2009
Sold by
Secretary Of Housing & Urban Development
Bought by
Moore Arlene M
Home Financials for this Owner
Home Financials are based on the most recent Mortgage that was taken out on this home.
Original Mortgage
$84,000
Outstanding Balance
$54,790
Interest Rate
4.9%
Mortgage Type
New Conventional
Estimated Equity
$265,718
Purchase Details
Closed on
Sep 29, 2009
Sold by
Beatty Kevin J and Case #2009Ci0067
Bought by
Chase Home Finance Llc
Purchase Details
Closed on
Jul 16, 2009
Sold by
Chase Home Finance Llc
Bought by
Secretary Of Housing & Urban Development
Purchase Details
Closed on
Jun 24, 2005
Sold by
Maronda Homes Inc Of Ohio
Bought by
Beatty Kevin J and Beatty Kelly J
Home Financials for this Owner
Home Financials are based on the most recent Mortgage that was taken out on this home.
Original Mortgage
$107,500
Interest Rate
6.5%
Mortgage Type
Fannie Mae Freddie Mac
Create a Home Valuation Report for This Property
The Home Valuation Report is an in-depth analysis detailing your home's value as well as a comparison with similar homes in the area
Home Values in the Area
Average Home Value in this Area
Purchase History
| Date | Buyer | Sale Price | Title Company |
|---|---|---|---|
| Johnson Amber L | $115,000 | None Available | |
| Moore Arlene M | $107,000 | Transcounty Title | |
| Chase Home Finance Llc | $80,000 | None Available | |
| Secretary Of Housing & Urban Development | -- | None Available | |
| Beatty Kevin J | $134,400 | Stewart Title Agency |
Source: Public Records
Mortgage History
| Date | Status | Borrower | Loan Amount |
|---|---|---|---|
| Open | Moore Arlene M | $84,000 | |
| Previous Owner | Beatty Kevin J | $107,500 |
Source: Public Records
Tax History Compared to Growth
Tax History
| Year | Tax Paid | Tax Assessment Tax Assessment Total Assessment is a certain percentage of the fair market value that is determined by local assessors to be the total taxable value of land and additions on the property. | Land | Improvement |
|---|---|---|---|---|
| 2024 | -- | $76,850 | $6,200 | $70,650 |
| 2023 | $3,021 | $76,850 | $6,200 | $70,650 |
| 2022 | $2,391 | $56,090 | $5,200 | $50,890 |
| 2021 | $2,270 | $48,200 | $5,200 | $43,000 |
| 2020 | $1,956 | $48,200 | $5,200 | $43,000 |
| 2019 | $0 | $51,970 | $5,200 | $46,770 |
| 2018 | $2,200 | $51,970 | $5,200 | $46,770 |
| 2017 | $2,257 | $51,970 | $5,200 | $46,770 |
| 2016 | $1,691 | $38,770 | $5,180 | $33,590 |
| 2015 | $1,692 | $38,770 | $5,180 | $33,590 |
| 2014 | $1,693 | $38,770 | $5,180 | $33,590 |
| 2013 | $1,752 | $38,770 | $5,180 | $33,590 |
Source: Public Records
Map
Nearby Homes
- The Daffodil Plan at Riverbend at Scioto Landing
- The Daisy Plan at Riverbend at Scioto Landing
- The Avalon Plan at Riverbend at Scioto Landing
- The Aster Plan at Riverbend at Scioto Landing
- 0 U S 23
- 51 Henderson Ln
- 5050 S Walnut St
- 127 Boutot St
- Longwood Plan at Walker Pointe
- Birmingham Plan at Walker Pointe
- Sanibel Plan at Walker Pointe
- Carlisle Plan at Walker Pointe
- Somerset Plan at Walker Pointe
- Chattanooga Plan at Walker Pointe
- Rockford Plan at Walker Pointe
- Hoover Plan at Walker Pointe
- Sedona Plan at Walker Pointe
- Truman Plan at Walker Pointe
- Miramar Plan at Walker Pointe
- 5332 Karst Cir
- 19 Danielson Cir
- 23 Danielson Cir
- 23 Danielson Cir Unit 45
- 17 Danielson Cir
- 5015 West St
- 15 Danielson Cir
- 15 Danielson Cir Unit 41
- 5011 West St
- 20 Danielson Cir
- 22 Danielson Cir Unit 11
- 22 Danielson Cir
- 18 Danielson Cir
- 18 Danielson Cir Unit 9
- 5019 West St
- 13 Danielson Cir
- 13 Danielson Cir Unit 40
- 16 Danielson Cir
- 16 Danielson Cir Unit 8
- 14 Danielson Cir
- 5023 West St