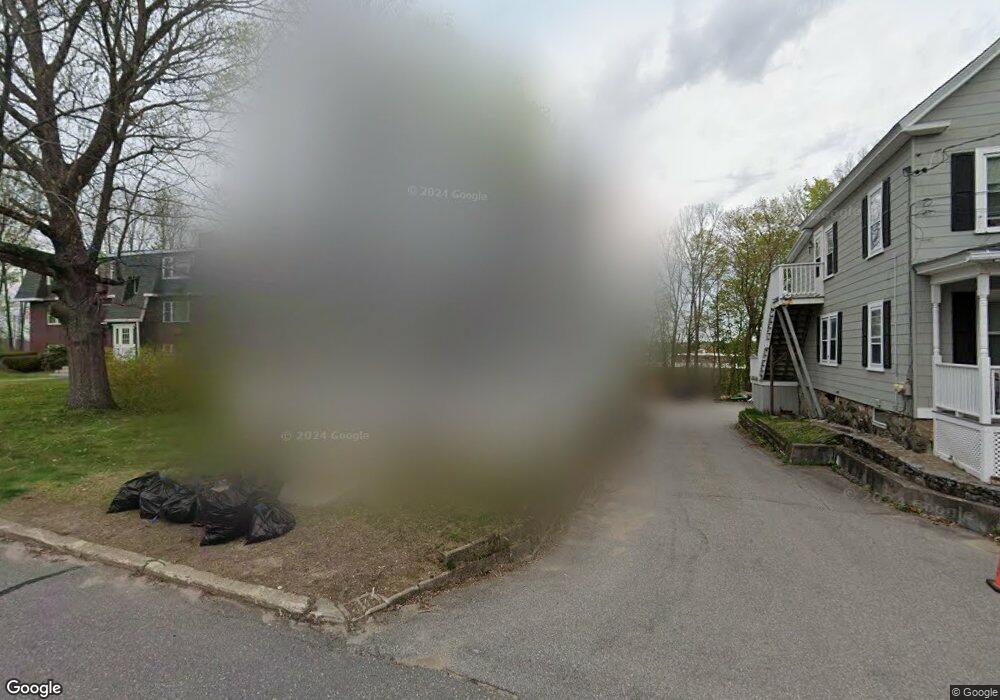
21 Dartmouth St Maynard, MA 01754
Estimated Value: $466,000 - $631,000
3
Beds
2
Baths
1,560
Sq Ft
$356/Sq Ft
Est. Value
About This Home
This home is located at 21 Dartmouth St, Maynard, MA 01754 and is currently estimated at $555,641, approximately $356 per square foot. 21 Dartmouth St is a home located in Middlesex County with nearby schools including Green Meadow School, Fowler School, and Maynard High School.
Ownership History
Date
Name
Owned For
Owner Type
Purchase Details
Closed on
Jun 27, 2014
Sold by
Mcnulty Lawrence E
Bought by
Grinnell Jonathan L
Current Estimated Value
Home Financials for this Owner
Home Financials are based on the most recent Mortgage that was taken out on this home.
Original Mortgage
$266,000
Outstanding Balance
$202,840
Interest Rate
4.19%
Mortgage Type
New Conventional
Estimated Equity
$352,801
Purchase Details
Closed on
Mar 9, 2005
Sold by
Starr Helga H and Starr Ronald J
Bought by
Starr Cru Rt
Create a Home Valuation Report for This Property
The Home Valuation Report is an in-depth analysis detailing your home's value as well as a comparison with similar homes in the area
Home Values in the Area
Average Home Value in this Area
Purchase History
| Date | Buyer | Sale Price | Title Company |
|---|---|---|---|
| Grinnell Jonathan L | $289,000 | -- | |
| Starr Cru Rt | -- | -- |
Source: Public Records
Mortgage History
| Date | Status | Borrower | Loan Amount |
|---|---|---|---|
| Open | Grinnell Jonathan L | $266,000 |
Source: Public Records
Tax History Compared to Growth
Tax History
| Year | Tax Paid | Tax Assessment Tax Assessment Total Assessment is a certain percentage of the fair market value that is determined by local assessors to be the total taxable value of land and additions on the property. | Land | Improvement |
|---|---|---|---|---|
| 2025 | $8,225 | $461,300 | $278,000 | $183,300 |
| 2024 | $8,012 | $448,100 | $264,800 | $183,300 |
| 2023 | $8,058 | $424,800 | $252,200 | $172,600 |
| 2022 | $7,888 | $384,400 | $211,800 | $172,600 |
| 2021 | $7,591 | $376,700 | $211,800 | $164,900 |
| 2020 | $7,358 | $356,500 | $191,600 | $164,900 |
| 2019 | $6,960 | $330,800 | $183,100 | $147,700 |
| 2018 | $6,214 | $288,000 | $166,400 | $121,600 |
| 2017 | $5,577 | $288,000 | $166,400 | $121,600 |
| 2016 | $6,120 | $288,000 | $166,400 | $121,600 |
| 2015 | $6,407 | $287,200 | $158,900 | $128,300 |
| 2014 | $6,767 | $303,600 | $153,800 | $149,800 |
Source: Public Records
Map
Nearby Homes
- 30-32 Walnut St
- 13 Arthur St Unit 15
- 15 Arthur St Unit 15
- 30 Acton St
- 2 Wall Ct
- 22-26 Waltham St
- 28 Waltham St Unit A
- 28 Waltham St Unit B
- 5 Hayes St Unit 5
- 91 Nason St
- 37 Glendale St
- 17 Prospect St
- 12 Walcott St
- 49 Summer Hill Rd
- 10 Mill St Unit Q
- 10 Mill St Unit B
- 250 Great Rd
- 66 Powder Mill Rd
- 7 King St
- 69 Powder Mill Rd
- 19 Dartmouth St
- 19 Dartmouth St Unit 1
- 19 Dartmouth St Unit 2
- 17 Dartmouth St
- 20 Dartmouth St Unit 22
- 22 Dartmouth St Unit 22
- 33 Dartmouth St Unit 5
- 33 Dartmouth St Unit 1
- 33 Dartmouth St Unit 3
- 33 Dartmouth St Unit 4
- 33 Dartmouth St Unit 2
- 33 Dartmouth St Unit 6
- 33 Dartmouth St
- 33 Dartmouth St Unit 6,33
- 33 Dartmouth St Unit 2,33
- 33 Dartmouth St Unit 5,33
- 33 Dartmouth St Unit 4,33
- 24 Dartmouth St
- 18 Dartmouth St
- 16 Dartmouth St