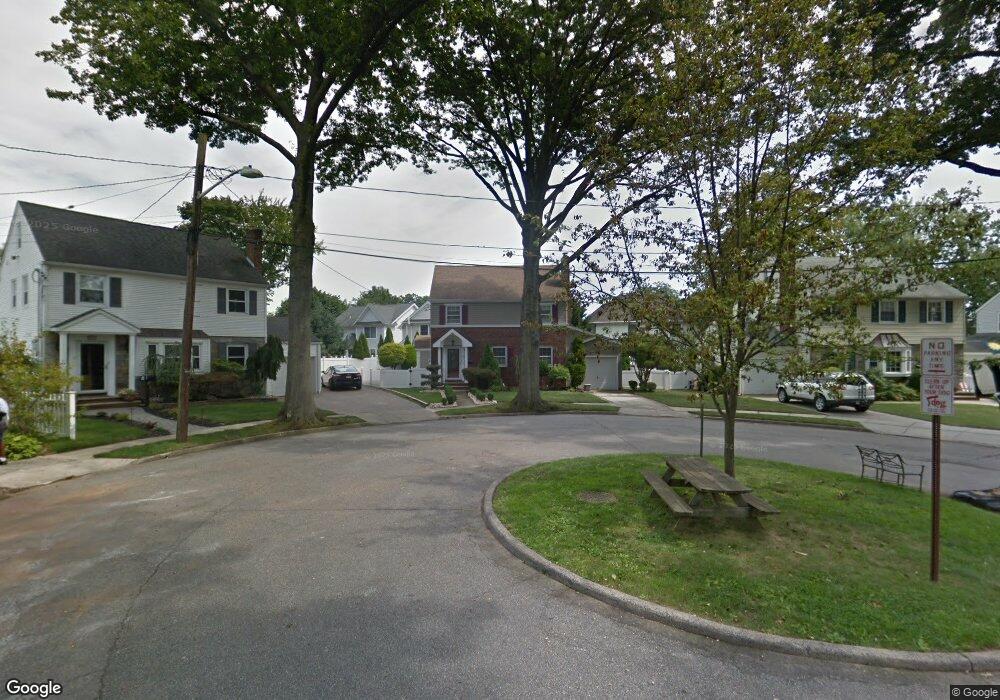
21 Davidson Rd Bloomfield, NJ 07003
Estimated Value: $770,000 - $907,000
Studio
--
Bath
2,189
Sq Ft
$382/Sq Ft
Est. Value
About This Home
This home is located at 21 Davidson Rd, Bloomfield, NJ 07003 and is currently estimated at $835,650, approximately $381 per square foot. 21 Davidson Rd is a home located in Essex County with nearby schools including Brookdale School, Bloomfield Middle School, and Bloomfield High School.
Ownership History
Date
Name
Owned For
Owner Type
Purchase Details
Closed on
Jul 31, 2000
Current Estimated Value
Home Financials for this Owner
Home Financials are based on the most recent Mortgage that was taken out on this home.
Original Mortgage
$209,200
Outstanding Balance
$74,753
Interest Rate
8.21%
Estimated Equity
$760,897
Purchase Details
Closed on
Jul 3, 2000
Sold by
Digiovanni Paulete
Bought by
Fenton Charles E and Fenton Cheryl A
Home Financials for this Owner
Home Financials are based on the most recent Mortgage that was taken out on this home.
Original Mortgage
$209,200
Outstanding Balance
$74,753
Interest Rate
8.21%
Estimated Equity
$760,897
Create a Home Valuation Report for This Property
The Home Valuation Report is an in-depth analysis detailing your home's value as well as a comparison with similar homes in the area
Home Values in the Area
Average Home Value in this Area
Purchase History
| Date | Buyer | Sale Price | Title Company |
|---|---|---|---|
| -- | $220,300 | -- | |
| Fenton Charles E | $220,250 | -- |
Source: Public Records
Mortgage History
| Date | Status | Borrower | Loan Amount |
|---|---|---|---|
| Open | Fenton Charles E | $209,200 |
Source: Public Records
Tax History
| Year | Tax Paid | Tax Assessment Tax Assessment Total Assessment is a certain percentage of the fair market value that is determined by local assessors to be the total taxable value of land and additions on the property. | Land | Improvement |
|---|---|---|---|---|
| 2025 | $16,536 | $506,000 | $253,000 | $253,000 |
| 2024 | $16,536 | $506,000 | $253,000 | $253,000 |
| 2022 | $16,202 | $506,000 | $253,000 | $253,000 |
| 2021 | $15,904 | $506,000 | $253,000 | $253,000 |
| 2020 | $15,661 | $506,000 | $253,000 | $253,000 |
| 2019 | $16,028 | $402,600 | $210,000 | $192,600 |
| 2018 | $15,959 | $402,600 | $210,000 | $192,600 |
| 2017 | $15,718 | $402,600 | $210,000 | $192,600 |
| 2016 | $15,540 | $402,600 | $210,000 | $192,600 |
| 2015 | $15,399 | $402,600 | $210,000 | $192,600 |
| 2014 | $14,554 | $402,600 | $210,000 | $192,600 |
Source: Public Records
Map
Nearby Homes
- 14 Davidson Rd
- 68 Bell St
- 1169 Broad St
- 15 Poe Ave
- 9 Glenfield Rd
- 58 Yantecaw Ave
- 26 Clairidge Ct
- 9 Mount Vernon Rd
- 5 Bellevue Ave
- 3 Christopher Ct
- 383-387 Broughton Ave
- 387 Broughton Ave
- 90 Dewey St
- 3 Collins Ave
- 45 Wells Ct
- 40 Golf Rd
- 17 Glen Ridge Pkwy
- 171 Sadler Rd
- 30 Andover Place
- 281 Forest Ave
Your Personal Tour Guide
Ask me questions while you tour the home.