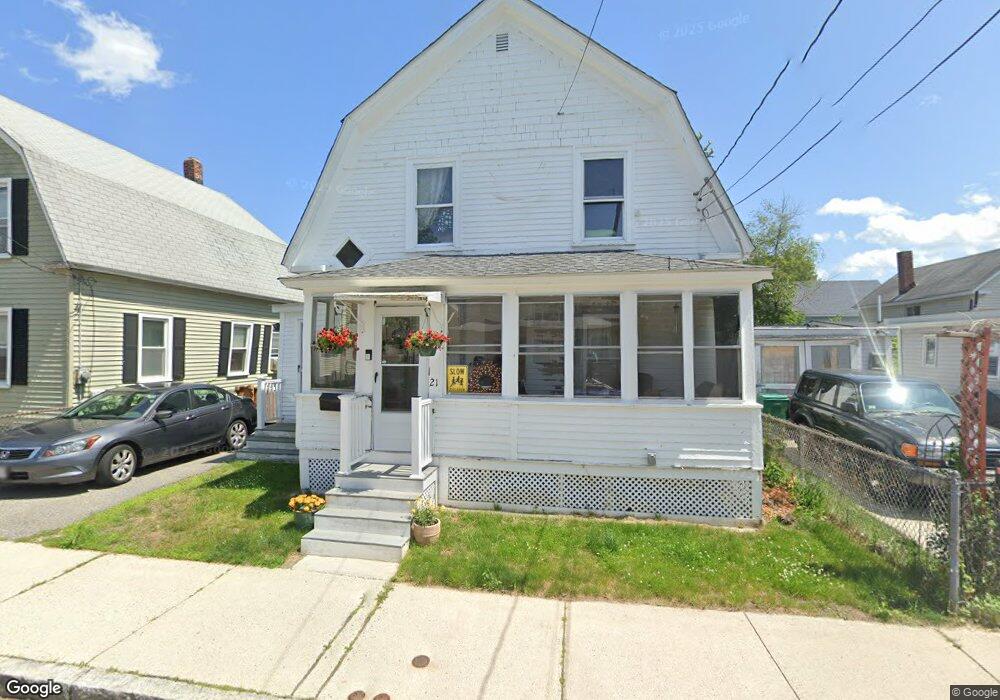
21 Delard St Lowell, MA 01850
Centralville NeighborhoodEstimated Value: $386,000 - $441,000
3
Beds
1
Bath
1,296
Sq Ft
$310/Sq Ft
Est. Value
About This Home
This home is located at 21 Delard St, Lowell, MA 01850 and is currently estimated at $402,345, approximately $310 per square foot. 21 Delard St is a home located in Middlesex County with nearby schools including Greenhalge Elementary School, S. Christa McAuliffe Elementary School, and Moody Elementary School.
Ownership History
Date
Name
Owned For
Owner Type
Purchase Details
Closed on
Nov 14, 2008
Sold by
Carbonneau Tracie and Tighe Tracie
Bought by
Carbonneau Tracie
Current Estimated Value
Purchase Details
Closed on
Aug 4, 2003
Sold by
Carbonneau Tracie and Tighe Tracie
Bought by
Carbonneau Lee and Carbonneau Tracie
Home Financials for this Owner
Home Financials are based on the most recent Mortgage that was taken out on this home.
Original Mortgage
$90,000
Interest Rate
5.28%
Mortgage Type
Purchase Money Mortgage
Purchase Details
Closed on
Apr 29, 1997
Sold by
Boland Rita
Bought by
Tighe Tracie L
Home Financials for this Owner
Home Financials are based on the most recent Mortgage that was taken out on this home.
Original Mortgage
$68,850
Interest Rate
7.77%
Mortgage Type
Purchase Money Mortgage
Create a Home Valuation Report for This Property
The Home Valuation Report is an in-depth analysis detailing your home's value as well as a comparison with similar homes in the area
Home Values in the Area
Average Home Value in this Area
Purchase History
| Date | Buyer | Sale Price | Title Company |
|---|---|---|---|
| Carbonneau Tracie | $72,500 | -- | |
| Carbonneau Tracie | $72,500 | -- | |
| Carbonneau Lee | -- | -- | |
| Carbonneau Lee | -- | -- | |
| Carbonneau Lee | -- | -- | |
| Tighe Tracie L | $72,500 | -- | |
| Tighe Tracie L | $72,500 | -- |
Source: Public Records
Mortgage History
| Date | Status | Borrower | Loan Amount |
|---|---|---|---|
| Previous Owner | Carbonneau Lee | $90,000 | |
| Previous Owner | Tighe Tracie L | $68,850 |
Source: Public Records
Tax History Compared to Growth
Tax History
| Year | Tax Paid | Tax Assessment Tax Assessment Total Assessment is a certain percentage of the fair market value that is determined by local assessors to be the total taxable value of land and additions on the property. | Land | Improvement |
|---|---|---|---|---|
| 2025 | $3,765 | $328,000 | $126,300 | $201,700 |
| 2024 | $3,759 | $315,600 | $125,500 | $190,100 |
| 2023 | $3,530 | $284,200 | $109,200 | $175,000 |
| 2022 | $3,245 | $255,700 | $99,300 | $156,400 |
| 2021 | $3,024 | $224,700 | $86,300 | $138,400 |
| 2020 | $2,704 | $202,400 | $70,900 | $131,500 |
| 2019 | $2,369 | $168,700 | $57,000 | $111,700 |
| 2018 | $2,548 | $177,100 | $54,300 | $122,800 |
| 2017 | $2,372 | $159,000 | $42,500 | $116,500 |
| 2016 | $2,310 | $152,400 | $45,700 | $106,700 |
| 2015 | $2,238 | $144,600 | $45,700 | $98,900 |
| 2013 | $2,236 | $149,000 | $61,000 | $88,000 |
Source: Public Records
Map
Nearby Homes
- 25 Delard St
- 47 Riverside Ave
- 17 Delard St
- 43 Riverside Ave
- 29 Delard St
- 28 West St
- 41 Riverside Ave
- 41 Riverside Ave
- 32 West St
- 33 Delard St
- 24 West St
- 48 Riverside Ave
- 48 Riverside Ave Unit 2
- 52 Riverside Ave
- 34 West St
- 22 Delard St
- 18 Delard St
- 26 Delard St
- 37 Delard St
- 37 Delard St Unit 2nd Floor