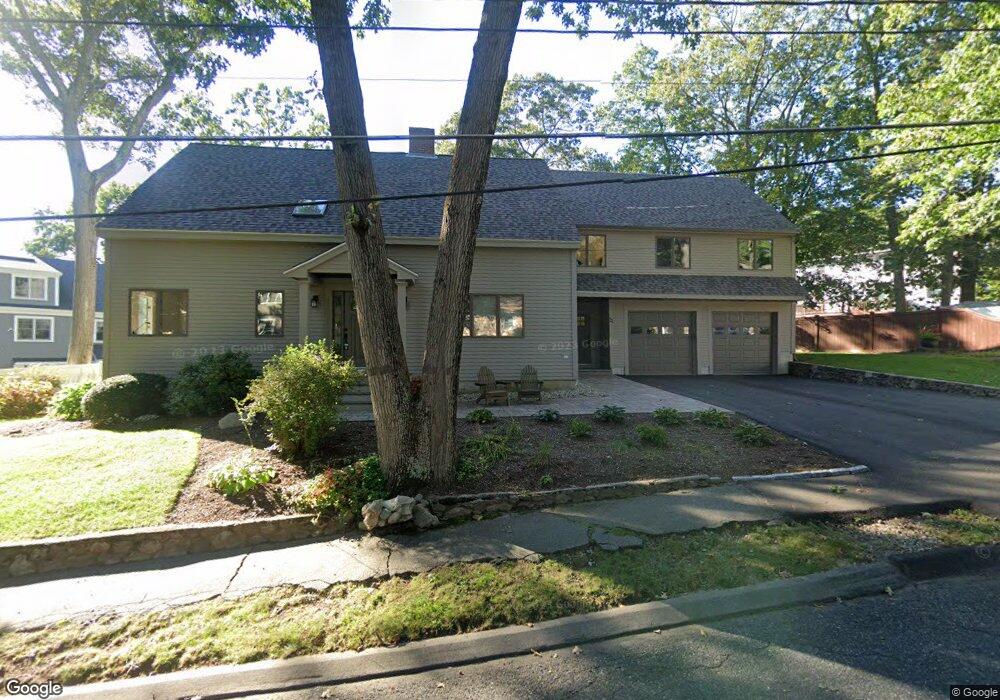
21 Dell Ave Needham, MA 02492
Estimated Value: $1,376,000 - $2,074,000
3
Beds
2
Baths
1,456
Sq Ft
$1,098/Sq Ft
Est. Value
About This Home
This home is located at 21 Dell Ave, Needham, MA 02492 and is currently estimated at $1,599,135, approximately $1,098 per square foot. 21 Dell Ave is a home located in Norfolk County with nearby schools including Mitchell Elementary School, High Rock Middle School, and Pollard Middle School.
Ownership History
Date
Name
Owned For
Owner Type
Purchase Details
Closed on
Jun 16, 2025
Sold by
Gustafson Deborah A
Bought by
Deborah A Gustafson T A and Deborah Gustafson
Current Estimated Value
Purchase Details
Closed on
Mar 20, 2024
Sold by
Gustafson Deborah A and Williamson Shirley M
Bought by
Gustafson Deborah A and Williamson Shirley A
Purchase Details
Closed on
Mar 1, 1985
Bought by
Gustafson Deborah A and Williamson Shirley M
Create a Home Valuation Report for This Property
The Home Valuation Report is an in-depth analysis detailing your home's value as well as a comparison with similar homes in the area
Home Values in the Area
Average Home Value in this Area
Purchase History
| Date | Buyer | Sale Price | Title Company |
|---|---|---|---|
| Deborah A Gustafson T A | -- | -- | |
| Deborah A Gustafson T A | -- | -- | |
| Gustafson Deborah A | -- | None Available | |
| Gustafson Deborah A | -- | None Available | |
| Gustafson Deborah A | -- | None Available | |
| Gustafson Deborah A | $137,400 | -- |
Source: Public Records
Mortgage History
| Date | Status | Borrower | Loan Amount |
|---|---|---|---|
| Previous Owner | Gustafson Deborah A | $118,500 | |
| Previous Owner | Gustafson Deborah A | $160,000 | |
| Previous Owner | Gustafson Deborah A | $160,000 |
Source: Public Records
Tax History
| Year | Tax Paid | Tax Assessment Tax Assessment Total Assessment is a certain percentage of the fair market value that is determined by local assessors to be the total taxable value of land and additions on the property. | Land | Improvement |
|---|---|---|---|---|
| 2025 | $14,448 | $1,363,000 | $806,400 | $556,600 |
| 2024 | $14,416 | $1,151,400 | $593,400 | $558,000 |
| 2023 | $14,426 | $1,106,300 | $593,400 | $512,900 |
| 2022 | $13,538 | $1,012,600 | $525,600 | $487,000 |
| 2021 | $10,866 | $833,900 | $525,600 | $308,300 |
| 2020 | $10,489 | $839,800 | $525,600 | $314,200 |
| 2019 | $9,768 | $788,400 | $478,200 | $310,200 |
| 2018 | $9,366 | $788,400 | $478,200 | $310,200 |
| 2017 | $8,897 | $748,300 | $478,200 | $270,100 |
| 2016 | $8,670 | $751,300 | $478,200 | $273,100 |
| 2015 | $8,482 | $751,300 | $478,200 | $273,100 |
| 2014 | $7,731 | $664,200 | $399,200 | $265,000 |
Source: Public Records
Map
Nearby Homes
- 190 Brookline St
- 17 Lindbergh Ave
- 638 Webster St
- 638 Webster St Unit 638
- 68 Brookline St
- 176 Highgate St
- 510 Webster St
- 36 Otis St Unit 36
- 58 Morton St
- 40 High St
- 19 Oakland Ave Unit 19
- 31 Birds Hill Ave
- 7 West St
- 19 Highland Ct Unit 19
- 28 Mercer Rd
- 100 Bradford St
- 143 Hunting Rd
- 126 Prince St
- 447 Hillside Ave
- 385 Hillside Ave
Your Personal Tour Guide
Ask me questions while you tour the home.