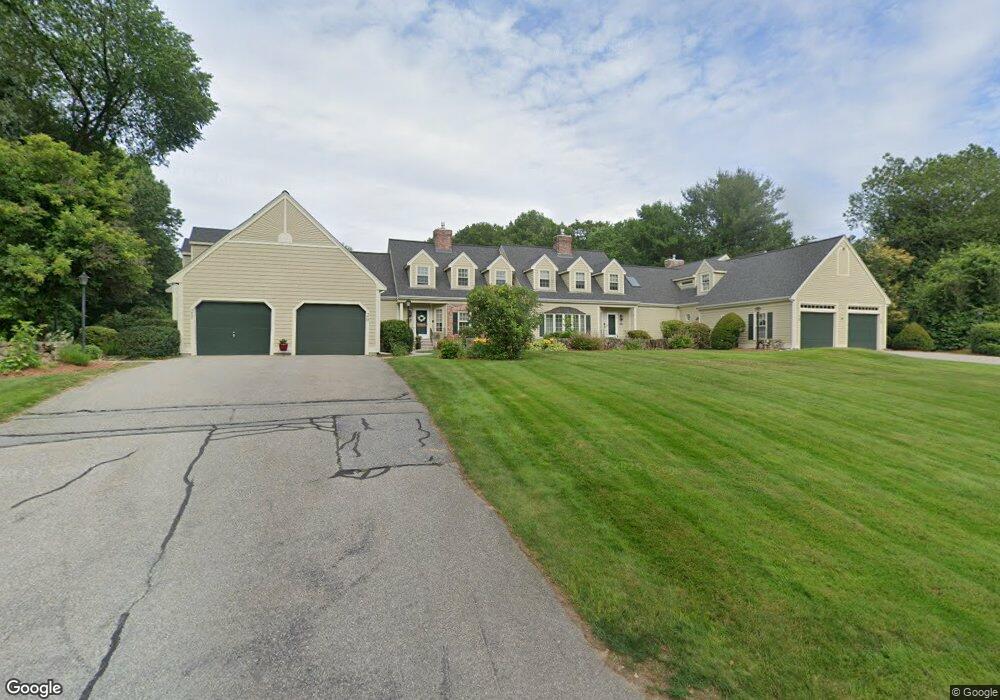
21 Derby Ln Unit 3 Tyngsboro, MA 01879
Estimated Value: $579,000 - $846,000
3
Beds
3
Baths
3,500
Sq Ft
$200/Sq Ft
Est. Value
About This Home
This home is located at 21 Derby Ln Unit 3, Tyngsboro, MA 01879 and is currently estimated at $698,636, approximately $199 per square foot. 21 Derby Ln Unit 3 is a home located in Middlesex County with nearby schools including Tyngsborough Elementary School, Tyngsborough Middle School, and Collegiate Charter School of Lowell.
Ownership History
Date
Name
Owned For
Owner Type
Purchase Details
Closed on
Jan 26, 2004
Sold by
Bolduc Glenn D
Bought by
Parson Edward F and Wilson Judith A
Current Estimated Value
Home Financials for this Owner
Home Financials are based on the most recent Mortgage that was taken out on this home.
Original Mortgage
$328,000
Interest Rate
5.89%
Mortgage Type
Purchase Money Mortgage
Purchase Details
Closed on
Mar 31, 1999
Sold by
Underwood Jacquelyn J
Bought by
Bolduc Glenn D
Home Financials for this Owner
Home Financials are based on the most recent Mortgage that was taken out on this home.
Original Mortgage
$220,000
Interest Rate
6.78%
Mortgage Type
Purchase Money Mortgage
Purchase Details
Closed on
Aug 30, 1996
Sold by
Bishoff Maurice and Bishoff Shirley
Bought by
Underwood Jacquelyn
Create a Home Valuation Report for This Property
The Home Valuation Report is an in-depth analysis detailing your home's value as well as a comparison with similar homes in the area
Home Values in the Area
Average Home Value in this Area
Purchase History
| Date | Buyer | Sale Price | Title Company |
|---|---|---|---|
| Parson Edward F | $410,000 | -- | |
| Bolduc Glenn D | $279,900 | -- | |
| Underwood Jacquelyn | $234,900 | -- |
Source: Public Records
Mortgage History
| Date | Status | Borrower | Loan Amount |
|---|---|---|---|
| Open | Underwood Jacquelyn | $311,500 | |
| Closed | Parson Edward F | $328,000 | |
| Previous Owner | Underwood Jacquelyn | $220,000 |
Source: Public Records
Tax History Compared to Growth
Tax History
| Year | Tax Paid | Tax Assessment Tax Assessment Total Assessment is a certain percentage of the fair market value that is determined by local assessors to be the total taxable value of land and additions on the property. | Land | Improvement |
|---|---|---|---|---|
| 2025 | $70 | $566,300 | $0 | $566,300 |
| 2024 | $7,007 | $550,900 | $0 | $550,900 |
| 2023 | $6,728 | $475,800 | $0 | $475,800 |
| 2022 | $6,175 | $413,300 | $0 | $413,300 |
| 2021 | $6,970 | $433,700 | $0 | $433,700 |
| 2020 | $6,500 | $400,000 | $0 | $400,000 |
| 2019 | $6,753 | $398,900 | $0 | $398,900 |
| 2018 | $6,368 | $372,200 | $0 | $372,200 |
| 2017 | $5,616 | $327,300 | $0 | $327,300 |
| 2016 | $6,097 | $347,200 | $0 | $347,200 |
| 2015 | $5,716 | $337,000 | $0 | $337,000 |
Source: Public Records
Map
Nearby Homes
- 123 Sherburne Ave
- 20 Merrimac Way Unit 20E
- 10 Worden Rd
- 24 Old Tyng Rd
- 1 Hope St
- 5 Mission Rd Unit 107
- 863 Wellman Ave Unit 863
- 17 Juniper Ln Unit 17
- 28 Juniper Ln Unit 65
- 11 Juniper Ln Unit 14
- 15 Dowling Dr
- 22 Juniper Ln Unit 66
- 1461 Pawtucket Blvd Unit 12
- 330 Wellman Ave
- 271 Wellman Ave
- 251 Wellman Ave Unit 251
- 739 Wellman Ave
- 12 Trotting Park Rd
- 730 Wellman Ave
- 436 Wellman Ave